0. Introduction
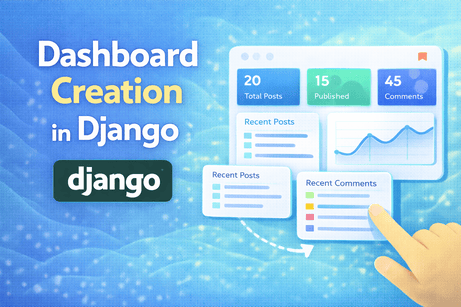
A dashboard is one of the most important features in modern web applications. It is the place where data becomes useful at a glance. Instead of forcing the user to browse many different pages, a dashboard gathers the most important information into one clear interface: statistics, recent activity, quick actions, notifications, charts, tasks, summaries, and personalized insights. In a Django project, building a dashboard is a powerful exercise because it combines backend logic, data aggregation, permissions, templates, queries, user experience, and performance optimization all in one feature.
A beginner may think a dashboard is just a page with boxes and numbers. But a real dashboard is much more than that. It is a carefully designed information layer between your database and the user. It answers questions like: What should this user see first? Which numbers matter most? Which actions should be easy? Which data should be filtered by role? Which queries should be optimized? How do we keep the page fast even when it contains a lot of information? These questions make dashboard building one of the best ways to move from simple CRUD pages to more professional Django applications.
In this tutorial, we will build a complete understanding of dashboard creation in Django. We will begin by explaining what a dashboard really is, then we will create a basic project structure, prepare models, build views that aggregate useful data, display cards and lists in templates, personalize the content per user, improve the layout, and discuss more advanced topics such as filtering, charts, permissions, performance, and dashboard architecture. The goal is not only to build a page that looks like a dashboard, but to understand how to design one properly.
1. What Is a Dashboard?
A dashboard is a page that summarizes key information and actions for a user.
Instead of showing raw database records one by one, a dashboard usually shows:
- total counts
- recent items
- progress indicators
- important alerts
- charts or trends
- user-specific shortcuts
- status summaries
- pending tasks
For example, in different kinds of Django projects, a dashboard may show:
Blog dashboard
- number of published posts
- number of drafts
- recent comments
- recent visitors
- top categories
E-commerce dashboard
- total orders
- revenue summary
- low-stock products
- pending shipments
- recent customers
Learning platform dashboard
- enrolled courses
- lesson completion rate
- upcoming assignments
- recent quiz scores
Admin dashboard
- new users
- system alerts
- recent content changes
- moderation queue
So a dashboard is not a random page with widgets. It is a carefully chosen summary of the most relevant information for a specific user or role.
2. Why Dashboards Matter in Django Projects
Dashboards matter because most users do not want to navigate the database directly. They want answers.
A dashboard helps answer questions quickly:
- How is my project doing?
- What changed recently?
- What needs my attention?
- What should I do next?
- What is the current status?
This makes dashboards one of the most valuable UX features in business applications, admin systems, SaaS platforms, content management tools, internal company software, and educational platforms.
For Django developers, dashboard creation is also a major step forward because it forces you to think in terms of aggregated information, not only individual pages. That is a big shift from beginner-level development to more advanced application design.
3. Common Types of Dashboards
Before building one, it helps to understand that not all dashboards are the same.
Personal dashboard
Shows information specific to the logged-in user.
Example:
- my posts
- my comments
- my saved items
- my tasks
Staff or admin dashboard
Shows management and system data.
Example:
- all users
- moderation queue
- system metrics
- content statistics
Business dashboard
Focuses on performance indicators.
Example:
- revenue
- orders
- sales growth
- customer activity
Operational dashboard
Focuses on current workflow and action items.
Example:
- pending requests
- unprocessed tickets
- upcoming deadlines
A good Django dashboard usually starts by clearly identifying who the user is and what they need to know first.
4. The Biggest Dashboard Design Principle
The most important principle is this:
A dashboard should show only what is useful for that user.
This sounds simple, but it changes everything.
A common beginner mistake is trying to put too much data into the dashboard. The result is a crowded page with many numbers, tables, and cards that do not help the user.
A better approach is to ask:
- Which information is most important?
- Which actions are most frequent?
- Which metrics help decisions?
- Which items need attention now?
A dashboard is about prioritization, not just display.
5. Example Project Context
To make the tutorial practical, let us imagine a content management application with:
- users
- posts
- comments
- categories
This will allow us to build a meaningful dashboard with counts, recent items, and status summaries.
Example models
from django.db import models
from django.conf import settings

class Category(models.Model):
    name = models.CharField(max_length=100)

    def __str__(self):
        return self.name


class Post(models.Model):
    STATUS_CHOICES = (
        ('draft', 'Draft'),
        ('published', 'Published'),
    )

    title = models.CharField(max_length=200)
    content = models.TextField()
    author = models.ForeignKey(settings.AUTH_USER_MODEL, on_delete=models.CASCADE)
    category = models.ForeignKey(Category, on_delete=models.SET_NULL, null=True, blank=True)
    status = models.CharField(max_length=20, choices=STATUS_CHOICES, default='draft')
    created_at = models.DateTimeField(auto_now_add=True)

    def __str__(self):
        return self.title


class Comment(models.Model):
    post = models.ForeignKey(Post, on_delete=models.CASCADE, related_name='comments')
    user = models.ForeignKey(settings.AUTH_USER_MODEL, on_delete=models.CASCADE)
    content = models.TextField()
    is_approved = models.BooleanField(default=True)
    created_at = models.DateTimeField(auto_now_add=True)

    def __str__(self):
        return f"Comment by {self.user}"
This is enough to create a useful dashboard.
6. What Should This Dashboard Show?
Let us imagine the dashboard is for a logged-in author. A useful first version might include:
- total number of posts written by the user
- total published posts
- total draft posts
- total comments on the user’s posts
- latest posts
- latest comments on the user’s content
This is already a strong dashboard because it gives both summary and recent activity.
Notice that we are not showing everything in the database. We are showing the information that matters to that specific user.
7. Protecting the Dashboard
A dashboard is usually a private page, so it should normally require authentication.
views.py
from django.contrib.auth.decorators import login_required
from django.shortcuts import render

@login_required
def dashboard(request):
    return render(request, 'dashboard/dashboard.html')
This is the correct first step.
A dashboard usually contains user-specific or admin-specific data, so making it public would often be incorrect.
8. Building the First Real Dashboard View
Now let us gather useful data.
views.py
from django.contrib.auth.decorators import login_required
from django.shortcuts import render
from django.db.models import Count
from .models import Post, Comment

@login_required
def dashboard(request):
    user = request.user

    total_posts = Post.objects.filter(author=user).count()
    published_posts = Post.objects.filter(author=user, status='published').count()
    draft_posts = Post.objects.filter(author=user, status='draft').count()

    total_comments = Comment.objects.filter(post__author=user).count()

    recent_posts = Post.objects.filter(author=user).order_by('-created_at')[:5]
    recent_comments = Comment.objects.filter(post__author=user).select_related('post', 'user').order_by('-created_at')[:5]

    context = {
        'total_posts': total_posts,
        'published_posts': published_posts,
        'draft_posts': draft_posts,
        'total_comments': total_comments,
        'recent_posts': recent_posts,
        'recent_comments': recent_comments,
    }

    return render(request, 'dashboard/dashboard.html', context)
9. Deep Explanation of the Dashboard View
This view is simple, but it introduces a very important dashboard concept: data aggregation.
Instead of retrieving one object and displaying its fields, we are computing meaningful summaries.
total_posts
Post.objects.filter(author=user).count()This tells the user how many posts they created.
published_posts and draft_posts
These counts separate content by status, which is often more useful than one total number.
For example, if a user has 20 posts but 15 are drafts, that tells a very different story than 20 published posts.
total_comments
Comment.objects.filter(post__author=user).count()This is a good example of querying across relationships.
We are not counting comments written by the user. We are counting comments on the user’s posts.
That is exactly the kind of “meaningful aggregation” a dashboard should provide.
recent_posts and recent_comments
A dashboard should usually combine:
- summary metrics
- recent activity
That is why these lists are useful. Numbers alone are not enough. Users often also want to see what changed recently.
10. Why Dashboard Data Should Be Role-Aware
The query logic above assumes the dashboard is for an author viewing their own content.
But what if the logged-in user is an admin? They might need different data, such as:
- all posts in the system
- unapproved comments
- total users
- latest signups
So dashboard logic often depends on role.
This is a critical concept. A dashboard is rarely universal. It is often personalized by permissions and responsibilities.
For example:
if request.user.is_staff:
    # show global admin metrics
else:
    # show personal author metrics
This is where dashboard design becomes closely linked to authorization logic.
11. First Template for the Dashboard
Let us now create a basic template.
dashboard.html
<h1>Dashboard</h1>
<p>Welcome, {{ request.user.username }}</p>

<div class="stats-grid">
    <div class="card">
        <h3>Total Posts</h3>
        <p>{{ total_posts }}</p>
    </div>

    <div class="card">
        <h3>Published Posts</h3>
        <p>{{ published_posts }}</p>
    </div>

    <div class="card">
        <h3>Draft Posts</h3>
        <p>{{ draft_posts }}</p>
    </div>

    <div class="card">
        <h3>Total Comments</h3>
        <p>{{ total_comments }}</p>
    </div>
</div>

<hr>

<h2>Recent Posts</h2>
<ul>
    {% for post in recent_posts %}
        <li>{{ post.title }} - {{ post.created_at }}</li>
    {% empty %}
        <li>No posts yet.</li>
    {% endfor %}
</ul>

<h2>Recent Comments</h2>
<ul>
    {% for comment in recent_comments %}
        <li>
            {{ comment.user.username }} commented on "{{ comment.post.title }}"
        </li>
    {% empty %}
        <li>No comments yet.</li>
    {% endfor %}
</ul>
12. Why Cards Are Common in Dashboards
Dashboard metrics are often shown in “cards” because cards separate information visually and make important values easy to scan.
A good dashboard card usually contains:
- a short label
- the main number or value
- optionally a small icon
- optionally a trend or comparison
For example:
- Total Posts → 18
- Drafts → 4
- Revenue → $2,130
- Open Tickets → 6
Cards are popular because they turn raw data into quick visual summaries.
13. Adding Better Styling
A dashboard should be easy to scan. Let us add simple CSS.
<style>
    .stats-grid {
        display: grid;
        grid-template-columns: repeat(auto-fit, minmax(220px, 1fr));
        gap: 20px;
        margin-bottom: 30px;
    }

    .card {
        padding: 20px;
        border: 1px solid #ddd;
        border-radius: 12px;
        background: #f9f9f9;
        box-shadow: 0 2px 6px rgba(0,0,0,0.05);
    }

    .card h3 {
        margin: 0 0 10px;
        font-size: 18px;
    }

    .card p {
        font-size: 28px;
        font-weight: bold;
        margin: 0;
    }
</style>
This makes the dashboard much more readable.
The purpose of styling here is not decoration. It is information clarity.
14. Building a Better Structure with Sections
As dashboards grow, structure matters.
A good layout often separates information into sections such as:
- summary cards
- recent activity
- charts
- shortcuts
- alerts
- tables
For example:
<section class="summary-section">...</section>
<section class="activity-section">...</section>
<section class="quick-actions-section">...</section>
This helps users process the page in layers instead of seeing one large block of mixed information.
15. Adding Quick Actions
A good dashboard often includes shortcuts for common actions.
Examples:
- Create new post
- Edit profile
- Review comments
- Add new product
- View reports
Template example:
<h2>Quick Actions</h2>
<div class="actions">
    <a href="{% url 'post_create' %}">Create New Post</a>
    <a href="{% url 'post_list' %}">Manage Posts</a>
    <a href="{% url 'profile' %}">My Profile</a>
</div>
This is useful because dashboards are not only for observation. They are also for action.
A dashboard should often help the user both understand and do.
16. Adding Recent Activity Feeds
Many dashboards feel more alive when they include recent events.
Examples:
- latest posts created
- recent comments received
- recent users joined
- latest orders
- recent updates
This is useful because counts alone are static. Activity feeds show what has happened recently.
For example, instead of just showing “24 comments,” it is more useful to also show:
- Alice commented on “Django Forms”
- Omar commented on “Docker Compose Guide”
That gives immediate context.
17. Why Context Matters More Than Raw Numbers
Suppose the dashboard shows:
- Comments: 27
That number is useful, but incomplete.
Now suppose it also shows:
- 5 new comments in the last 24 hours
- Latest comment: “Very helpful tutorial”
- Most-commented post: “JWT Authentication in Django”
That is much more meaningful.
This illustrates a key dashboard principle:
Good dashboards do not just show data. They show data in context.
18. Using Aggregation Functions
Dashboards often rely on ORM aggregation tools like:
CountSumAvgMaxMin
For example, suppose you want the number of posts per category.
Example
from django.db.models import Count
from .models import Category

top_categories = Category.objects.annotate(num_posts=Count('post')).order_by('-num_posts')[:5]
Then in the template:
<h2>Top Categories</h2>
<ul>
    {% for category in top_categories %}
        <li>{{ category.name }} ({{ category.num_posts }})</li>
    {% endfor %}
</ul>
This introduces one of the most useful dashboard skills: summarizing groups of records instead of listing every row individually.
19. Be Careful with Related Names in Aggregation
If your Post model uses:
category = models.ForeignKey(Category, related_name='posts', ...)then the annotation should use:
Count('posts')not Count('post').
So a more correct version would be:
top_categories = Category.objects.annotate(num_posts=Count('posts')).order_by('-num_posts')[:5]This detail matters because dashboards often use many reverse relationships and annotations.
Understanding related_name well makes dashboard queries much easier to write.
20. Adding a Chart to the Dashboard
Dashboards often contain charts because charts help users understand trends.
Examples:
- posts created over time
- monthly sales
- daily signups
- completion rate
- category distribution
A chart is most useful when the question involves change, comparison, or distribution.
For example, if you want to show the number of posts created per month, you could aggregate the data in Django and pass it to JavaScript chart code.
Basic idea in the view
from django.db.models.functions import TruncMonth
from django.db.models import Count

posts_by_month = (
    Post.objects.filter(author=request.user)
    .annotate(month=TruncMonth('created_at'))
    .values('month')
    .annotate(total=Count('id'))
    .order_by('month')
)
This gives you trend-ready data.
21. Why Charts Should Be Used Carefully
Charts are useful, but they should not be added just for decoration.
Use a chart when it helps answer a meaningful question, such as:
- Are my posts increasing over time?
- Which months had the most content activity?
- Is performance improving or declining?
Do not add a chart just because dashboards “look modern” with charts. A chart without a clear question often becomes visual noise.
This is part of dashboard maturity: every component should earn its place.
22. Personalizing the Dashboard by User
A dashboard should often feel personal.
Examples of personalization:
- greeting the user by name
- showing only their posts or tasks
- showing their progress
- displaying their role
- presenting relevant shortcuts
For example:
<p>Welcome back, {{ request.user.first_name|default:request.user.username }}</p>This small touch helps the dashboard feel less like a generic report and more like a real user workspace.
23. Staff Dashboard vs Author Dashboard
A more advanced design is to show different dashboards depending on user type.
Example logic
@login_required
def dashboard(request):
    if request.user.is_staff:
        return admin_dashboard(request)
    return author_dashboard(request)
Then create separate functions:
def author_dashboard(request):
    # personal post metrics
    ...

def admin_dashboard(request):
    # system-wide moderation and content metrics
    ...
This is often cleaner than putting all dashboard logic into one giant view.
It also makes the code easier to maintain and more explicit.
24. Example of an Admin Dashboard
Suppose staff users need a global overview.
Example view
from django.contrib.auth import get_user_model

User = get_user_model()

@login_required
def admin_dashboard(request):
    total_users = User.objects.count()
    total_posts = Post.objects.count()
    total_comments = Comment.objects.count()
    pending_comments = Comment.objects.filter(is_approved=False).count()

    recent_users = User.objects.order_by('-date_joined')[:5]
    recent_posts = Post.objects.select_related('author').order_by('-created_at')[:5]

    return render(request, 'dashboard/admin_dashboard.html', {
        'total_users': total_users,
        'total_posts': total_posts,
        'total_comments': total_comments,
        'pending_comments': pending_comments,
        'recent_users': recent_users,
        'recent_posts': recent_posts,
    })
This shows how a dashboard changes based on role and responsibility.
25. Why Permissions Matter in Dashboards
A dashboard often reveals sensitive information.
Examples:
- total revenue
- user emails
- moderation queue
- private content
- internal activity
So dashboard pages should be protected not only with authentication, but often with authorization.
For example:
from django.contrib.admin.views.decorators import staff_member_required

@staff_member_required
def admin_dashboard(request):
    ...
or
if not request.user.is_staff:
    return HttpResponseForbidden()
This is very important. A dashboard is often one of the most information-dense pages in the whole application.
26. Reducing Query Count
Because dashboards gather many pieces of information, they can easily become query-heavy.
For example, one page may fetch:
- counts
- recent posts
- recent comments
- top categories
- pending items
- chart data
If you are not careful, the dashboard can become slow.
Some common optimization tools:
select_related()prefetch_related()annotate()- limiting result counts
- caching expensive summaries
- avoiding repeated queries in templates
For example:
recent_comments = Comment.objects.filter(post__author=user).select_related('user', 'post')[:5]This reduces extra database hits when rendering each comment’s author and post.
27. Why Dashboards Often Need Caching
Some dashboard metrics may be expensive to compute, especially in large systems.
Examples:
- total sales across thousands of orders
- engagement summary over many events
- large chart aggregations
- complex leaderboard queries
If these values do not need to be recalculated on every request, caching can improve performance significantly.
For example, you might cache:
- top 5 categories
- total published posts
- monthly aggregates
Dashboards are often perfect candidates for caching because they tend to display summary data that changes less frequently than raw records.
28. Organizing Dashboard Logic Cleanly
As dashboards grow, the view can become too large. One clean approach is to move logic into helper functions or services.
Example:
def get_author_dashboard_data(user):
    return {
        'total_posts': Post.objects.filter(author=user).count(),
        'published_posts': Post.objects.filter(author=user, status='published').count(),
        'draft_posts': Post.objects.filter(author=user, status='draft').count(),
        'recent_posts': Post.objects.filter(author=user).order_by('-created_at')[:5],
    }
Then in the view:
@login_required
def dashboard(request):
    context = get_author_dashboard_data(request.user)
    return render(request, 'dashboard/dashboard.html', context)
This is often better than putting dozens of lines of query logic directly inside the view.
29. Why Separation of Concerns Matters
A dashboard often grows faster than expected. Today it shows four cards. Tomorrow it shows charts, filters, notifications, and role-based sections.
If everything is written directly in one long view, maintenance becomes difficult.
Separating dashboard logic into functions, services, or modules helps because it makes the code:
- easier to test
- easier to read
- easier to extend
- easier to reuse
Dashboards are a great example of why clean architecture matters even in Django templates-and-views projects.
30. Adding Filters to the Dashboard
Some dashboards become even more useful when users can filter the displayed data.
Examples:
- this week / this month / this year
- only published posts
- only a selected category
- only approved comments
Example:
status = request.GET.get('status')

posts = Post.objects.filter(author=request.user)

if status:
    posts = posts.filter(status=status)
This allows the dashboard to become interactive instead of static.
However, filters should be used carefully. The dashboard should still feel simple and focused, not like a complicated reporting page unless that is truly the goal.
31. Dashboard vs Reporting Page
This distinction is important.
A dashboard usually provides a quick overview.
A report page often provides deeper detail, filtering, exports, and analysis.
Many beginners accidentally try to turn the dashboard into a full reporting system. That often makes the page too complex.
A better design is:
- dashboard = summary and quick insight
- report page = deep analysis
This separation keeps the dashboard focused and fast.
32. Adding Notifications or Alerts
A powerful dashboard often shows items that require attention.
Examples:
- unapproved comments
- overdue tasks
- posts missing categories
- failed payments
- low stock alerts
For example:
unapproved_comments = Comment.objects.filter(post__author=request.user, is_approved=False).count()Then show:
{% if unapproved_comments %}
    <div class="alert">
        You have {{ unapproved_comments }} comment{{ unapproved_comments|pluralize }} waiting for review.
    </div>
{% endif %}
This is useful because dashboards should not only inform users. They should also highlight what needs action.
33. Empty States Matter Too
A good dashboard must also handle the case where there is little or no data.
Examples:
- no posts yet
- no comments yet
- no tasks assigned
- no recent activity
Instead of leaving sections empty, show helpful messages like:
- “You have not created any posts yet.”
- “Start by publishing your first article.”
- “No recent comments yet.”
This makes the dashboard feel complete even for new users.
34. Example of a More Complete Dashboard Template
<h1>Dashboard</h1>
<p>Welcome back, {{ request.user.username }}</p>

<div class="stats-grid">
    <div class="card">
        <h3>Total Posts</h3>
        <p>{{ total_posts }}</p>
    </div>
    <div class="card">
        <h3>Published</h3>
        <p>{{ published_posts }}</p>
    </div>
    <div class="card">
        <h3>Drafts</h3>
        <p>{{ draft_posts }}</p>
    </div>
    <div class="card">
        <h3>Comments</h3>
        <p>{{ total_comments }}</p>
    </div>
</div>

{% if unapproved_comments %}
    <div class="alert-box">
        You have {{ unapproved_comments }} pending comment{{ unapproved_comments|pluralize }}.
    </div>
{% endif %}

<section>
    <h2>Quick Actions</h2>
    <a href="{% url 'post_create' %}">Create New Post</a>
    <a href="{% url 'post_list' %}">Manage Posts</a>
</section>

<section>
    <h2>Recent Posts</h2>
    <ul>
        {% for post in recent_posts %}
            <li>{{ post.title }} — {{ post.created_at|date:"M d, Y" }}</li>
        {% empty %}
            <li>No posts yet.</li>
        {% endfor %}
    </ul>
</section>

<section>
    <h2>Recent Comments</h2>
    <ul>
        {% for comment in recent_comments %}
            <li>
                {{ comment.user.username }} on "{{ comment.post.title }}"
            </li>
        {% empty %}
            <li>No comments yet.</li>
        {% endfor %}
    </ul>
</section>
This is already a very usable dashboard foundation.
35. Common Beginner Mistakes
Here are some very common mistakes in dashboard creation.
Mistake 1: Putting too much information on one page
A dashboard should be focused, not overloaded.
Mistake 2: Showing data that is not relevant to the user
The page should be role-aware and personalized.
Mistake 3: Writing inefficient queries
Dashboards can easily become slow if every card and list causes extra database work.
Mistake 4: Treating the dashboard like a normal list page
A dashboard is about summary and context, not raw record dumping.
Mistake 5: Ignoring permissions
Sensitive metrics must be protected.
Mistake 6: No empty-state design
A dashboard should still feel useful when the user is new.
These mistakes are common because dashboards involve both backend and UX design. Good implementation requires thinking in both directions.
36. A Clean Practical Example with Helper Function
services.py
from .models import Post, Comment

def get_user_dashboard_data(user):
    total_posts = Post.objects.filter(author=user).count()
    published_posts = Post.objects.filter(author=user, status='published').count()
    draft_posts = Post.objects.filter(author=user, status='draft').count()
    total_comments = Comment.objects.filter(post__author=user).count()
    unapproved_comments = Comment.objects.filter(post__author=user, is_approved=False).count()

    recent_posts = Post.objects.filter(author=user).order_by('-created_at')[:5]
    recent_comments = Comment.objects.filter(post__author=user).select_related('user', 'post').order_by('-created_at')[:5]

    return {
        'total_posts': total_posts,
        'published_posts': published_posts,
        'draft_posts': draft_posts,
        'total_comments': total_comments,
        'unapproved_comments': unapproved_comments,
        'recent_posts': recent_posts,
        'recent_comments': recent_comments,
    }
views.py
from django.contrib.auth.decorators import login_required
from django.shortcuts import render
from .services import get_user_dashboard_data

@login_required
def dashboard(request):
    context = get_user_dashboard_data(request.user)
    return render(request, 'dashboard/dashboard.html', context)
This pattern is very good for maintainability.
37. Taking the Dashboard Further
Once the basic dashboard works, you can gradually improve it with features such as:
- charts
- per-role dashboards
- advanced filters
- date range selectors
- cached metrics
- inline notifications
- moderation queues
- user profile widgets
- top-performing content
- export/report links
The key is to grow the dashboard intentionally, not randomly.
A dashboard becomes powerful when each addition has a clear reason.
38. What You Learned in This Tutorial
In this tutorial, you learned that a Django dashboard is far more than a page with statistics. It is a focused summary interface that helps users understand status, activity, and priorities quickly. You saw how to protect dashboards with authentication, how to aggregate useful data with counts and filtered querysets, how to combine summary cards with recent activity lists, how to structure templates for readability, and how to personalize the content for the logged-in user. You also explored more advanced ideas such as role-based dashboards, alerts, charts, filters, performance optimization, caching, and separation of dashboard logic into helper functions or service layers.
Most importantly, you learned the central design idea behind dashboard creation: a good dashboard is not about showing all available data, but about showing the right data in the right way for the right user.
39. Conclusion
Dashboard creation in Django is one of the best exercises for moving toward real-world application development. It requires you to think not only like a programmer, but also like a product designer and information architect. You must decide what matters, how to summarize it, how to personalize it, how to keep it fast, and how to guide the user from information to action. That is why dashboards are such an important milestone in Django learning.
The best way to build a dashboard is to start small but meaningful: a few well-chosen metrics, a recent activity section, and clear quick actions. Then, as the project grows, you can add charts, filters, alerts, and role-specific views. If the foundation is clean, the dashboard can grow into one of the most valuable parts of your application.






💬 Comments
No comments yet. Be the first to comment!
Login to comment.