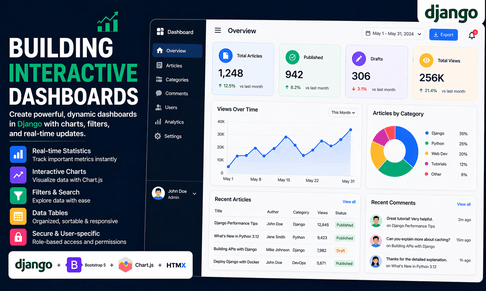
Building interactive dashboards in Django is an important skill because many real-world web applications need more than simple pages. A dashboard gives users a central place where they can view important information, track activity, analyze data, manage records, and make decisions quickly. In a Django application, dashboards can be used for admin panels, analytics pages, e-commerce management, learning platforms, project management systems, blog statistics, user profiles, financial summaries, IoT monitoring, and many other professional use cases.
A dashboard is not just a page with numbers. A good dashboard combines backend data, visual organization, user permissions, filters, charts, tables, alerts, and sometimes real-time updates. Django is very strong for this because it can collect data from models, aggregate statistics using the ORM, protect access with authentication, render templates, and serve dynamic content. When combined with Bootstrap, Tailwind CSS, AJAX, HTMX, or chart libraries, Django can produce modern dashboards that are useful, responsive, and interactive.
1. What Is an Interactive Dashboard?
An interactive dashboard is a web page that displays important information in a structured and dynamic way. Unlike a static report, an interactive dashboard allows the user to filter data, search records, change date ranges, open details, update sections without full reloads, and sometimes view charts that respond to user actions.
For example, in a blog dashboard, the user may want to see:
Total articles
Published articles
Draft articles
Most viewed posts
Recent comments
Monthly publication statistics
Category performance
Search and filter by date
In an e-commerce dashboard, the user may want to see:
Total orders
Revenue
Pending orders
Best-selling products
Customer activity
Sales by month
Recent transactions
Low-stock products
The goal of a dashboard is to make complex data easier to understand.
2. Creating a Basic Django Dashboard View
A dashboard usually starts with a protected view. Most dashboards should not be public. They should be accessible only to authenticated users, staff users, managers, or admins.
Example:
from django.contrib.auth.decorators import login_required
from django.shortcuts import render

@login_required
def dashboard(request):
    return render(request, "dashboard/home.html")
Then add the URL:
from django.urls import path
from .views import dashboard

urlpatterns = [
    path("dashboard/", dashboard, name="dashboard"),
]
This creates a simple protected dashboard page.
3. Example Models for Dashboard Data
Let us imagine a blog/content platform. We may have models like this:
from django.db import models
from django.contrib.auth.models import User

class Category(models.Model):
    name = models.CharField(max_length=100)

    def __str__(self):
        return self.name


class Article(models.Model):
    STATUS_CHOICES = [
        ("draft", "Draft"),
        ("published", "Published"),
    ]

    title = models.CharField(max_length=200)
    author = models.ForeignKey(User, on_delete=models.CASCADE)
    category = models.ForeignKey(Category, on_delete=models.SET_NULL, null=True)
    content = models.TextField()
    status = models.CharField(max_length=20, choices=STATUS_CHOICES, default="draft")
    views = models.PositiveIntegerField(default=0)
    created_at = models.DateTimeField(auto_now_add=True)
    published_at = models.DateTimeField(null=True, blank=True)

    def __str__(self):
        return self.title
These models give us enough data to build statistics such as total articles, published posts, drafts, views, and category counts.
4. Calculating Dashboard Statistics with Django ORM
The backend view should collect the data before sending it to the template.
from django.contrib.auth.decorators import login_required
from django.shortcuts import render
from django.db.models import Count, Sum
from .models import Article, Category

@login_required
def dashboard(request):
    total_articles = Article.objects.count()
    published_articles = Article.objects.filter(status="published").count()
    draft_articles = Article.objects.filter(status="draft").count()
    total_views = Article.objects.aggregate(total=Sum("views"))["total"] or 0

    top_articles = Article.objects.order_by("-views")[:5]

    categories = Category.objects.annotate(
        article_count=Count("article")
    ).order_by("-article_count")

    context = {
        "total_articles": total_articles,
        "published_articles": published_articles,
        "draft_articles": draft_articles,
        "total_views": total_views,
        "top_articles": top_articles,
        "categories": categories,
    }

    return render(request, "dashboard/home.html", context)
Here, Django uses the ORM to calculate statistics. The count() method counts records. The aggregate() method calculates a global value, such as total views. The annotate() method adds calculated values to each category.
5. Dashboard Template Structure
A dashboard template should be clear and organized. A typical structure includes:
Header
Summary statistic cards
Charts section
Recent activity table
Filters/search area
Quick action buttons
Example using Bootstrap:
{% extends "base.html" %}

{% block content %}
<div class="container py-5">

    <div class="d-flex justify-content-between align-items-center mb-4">
        <div>
            <h1 class="fw-bold">Dashboard</h1>
            <p class="text-muted">Overview of your content performance.</p>
        </div>
        <a href="#" class="btn btn-primary">Create Article</a>
    </div>

    <div class="row g-4 mb-5">
        <div class="col-md-3">
            <div class="card shadow-sm border-0">
                <div class="card-body">
                    <p class="text-muted mb-1">Total Articles</p>
                    <h3 class="fw-bold">{{ total_articles }}</h3>
                </div>
            </div>
        </div>

        <div class="col-md-3">
            <div class="card shadow-sm border-0">
                <div class="card-body">
                    <p class="text-muted mb-1">Published</p>
                    <h3 class="fw-bold">{{ published_articles }}</h3>
                </div>
            </div>
        </div>

        <div class="col-md-3">
            <div class="card shadow-sm border-0">
                <div class="card-body">
                    <p class="text-muted mb-1">Drafts</p>
                    <h3 class="fw-bold">{{ draft_articles }}</h3>
                </div>
            </div>
        </div>

        <div class="col-md-3">
            <div class="card shadow-sm border-0">
                <div class="card-body">
                    <p class="text-muted mb-1">Total Views</p>
                    <h3 class="fw-bold">{{ total_views }}</h3>
                </div>
            </div>
        </div>
    </div>

</div>
{% endblock %}
This gives the dashboard a professional first section with summary cards.
6. Adding Charts to the Dashboard
Charts make dashboards easier to understand. A popular frontend library for this is Chart.js. Django prepares the data, and JavaScript displays it visually.
In the view:
@login_required
def dashboard(request):
    categories = Category.objects.annotate(
        article_count=Count("article")
    ).order_by("name")

    category_labels = [category.name for category in categories]
    category_data = [category.article_count for category in categories]

    context = {
        "category_labels": category_labels,
        "category_data": category_data,
    }

    return render(request, "dashboard/home.html", context)
In the template:
<script src="https://cdn.jsdelivr.net/npm/chart.js"></script>

<div class="card shadow-sm border-0 mb-5">
    <div class="card-body">
        <h5 class="fw-bold mb-4">Articles by Category</h5>
        <canvas id="categoryChart"></canvas>
    </div>
</div>

<script>
    const categoryLabels = {{ category_labels|safe }};
    const categoryData = {{ category_data|safe }};

    const ctx = document.getElementById("categoryChart");

    new Chart(ctx, {
        type: "bar",
        data: {
            labels: categoryLabels,
            datasets: [{
                label: "Articles",
                data: categoryData
            }]
        }
    });
</script>
The important point is that Django sends Python data to the template, and JavaScript transforms it into a chart.
7. Safer JSON Data with json_script
Instead of using |safe directly, Django provides json_script, which is safer and cleaner.
In the template:
{{ category_labels|json_script:"category-labels" }}
{{ category_data|json_script:"category-data" }}

<script>
    const categoryLabels = JSON.parse(
        document.getElementById("category-labels").textContent
    );

    const categoryData = JSON.parse(
        document.getElementById("category-data").textContent
    );
</script>
This approach avoids many common problems when passing data from Django to JavaScript.
8. Adding Tables for Recent Data
Dashboards often need tables for detailed data.
<div class="card shadow-sm border-0">
    <div class="card-body">
        <h5 class="fw-bold mb-4">Top Articles</h5>

        <div class="table-responsive">
            <table class="table align-middle">
                <thead>
                    <tr>
                        <th>Title</th>
                        <th>Status</th>
                        <th>Views</th>
                    </tr>
                </thead>
                <tbody>
                    {% for article in top_articles %}
                        <tr>
                            <td>{{ article.title }}</td>
                            <td>
                                {% if article.status == "published" %}
                                    <span class="badge bg-success">Published</span>
                                {% else %}
                                    <span class="badge bg-secondary">Draft</span>
                                {% endif %}
                            </td>
                            <td>{{ article.views }}</td>
                        </tr>
                    {% empty %}
                        <tr>
                            <td colspan="3" class="text-muted">No articles found.</td>
                        </tr>
                    {% endfor %}
                </tbody>
            </table>
        </div>

    </div>
</div>
Tables are useful because not all dashboard information should be shown as charts. Charts are good for trends and comparisons, while tables are better for exact details.
9. Adding Filters to the Dashboard
Interactive dashboards often allow filtering by date, category, status, or keyword.
Example view:
@login_required
def dashboard(request):
    status = request.GET.get("status")
    category_id = request.GET.get("category")

    articles = Article.objects.all()

    if status:
        articles = articles.filter(status=status)

    if category_id:
        articles = articles.filter(category_id=category_id)

    total_articles = articles.count()
    total_views = articles.aggregate(total=Sum("views"))["total"] or 0

    categories = Category.objects.all()

    context = {
        "articles": articles[:10],
        "categories": categories,
        "total_articles": total_articles,
        "total_views": total_views,
        "selected_status": status,
        "selected_category": category_id,
    }

    return render(request, "dashboard/home.html", context)
Template filter form:
<form method="get" class="row g-3 mb-4">
    <div class="col-md-4">
        <select name="status" class="form-select">
            <option value="">All Statuses</option>
            <option value="published" {% if selected_status == "published" %}selected{% endif %}>
                Published
            </option>
            <option value="draft" {% if selected_status == "draft" %}selected{% endif %}>
                Draft
            </option>
        </select>
    </div>

    <div class="col-md-4">
        <select name="category" class="form-select">
            <option value="">All Categories</option>
            {% for category in categories %}
                <option value="{{ category.id }}" {% if selected_category == category.id|stringformat:"s" %}selected{% endif %}>
                    {{ category.name }}
                </option>
            {% endfor %}
        </select>
    </div>

    <div class="col-md-4">
        <button type="submit" class="btn btn-primary w-100">Apply Filters</button>
    </div>
</form>
This is simple but powerful. The user can change filters, submit the form, and the dashboard updates based on the selected criteria.
10. Making the Dashboard More Interactive with AJAX or HTMX
A dashboard becomes more interactive when sections can update without refreshing the full page. For example, you can update a table when a filter changes.
With HTMX, the filter could look like this:
<select
    name="status"
    hx-get="{% url 'dashboard_articles_partial' %}"
    hx-target="#articles-table"
    hx-trigger="change">
    <option value="">All</option>
    <option value="published">Published</option>
    <option value="draft">Draft</option>
</select>

<div id="articles-table">
    {% include "dashboard/partials/articles_table.html" %}
</div>
Then the Django view returns only the table partial:
@login_required
def dashboard_articles_partial(request):
    status = request.GET.get("status")
    articles = Article.objects.all()

    if status:
        articles = articles.filter(status=status)

    return render(request, "dashboard/partials/articles_table.html", {
        "articles": articles[:10]
    })
This makes the dashboard feel faster and smoother because only one section changes.
11. User Permissions in Dashboards
Dashboards often contain sensitive data, so permissions are essential. You can restrict access to staff users:
from django.contrib.admin.views.decorators import staff_member_required

@staff_member_required
def admin_dashboard(request):
    return render(request, "dashboard/admin.html")
Or use custom permissions:
from django.contrib.auth.decorators import permission_required

@permission_required("core.view_article", raise_exception=True)
def dashboard(request):
    return render(request, "dashboard/home.html")
Never rely only on hiding buttons in the frontend. Always protect the view itself.
12. Performance Best Practices
Dashboards can become slow if they calculate too much data on every request. Use these practices:
Use select_related for ForeignKey relationships.
Use prefetch_related for ManyToMany relationships.
Use annotate and aggregate instead of Python loops.
Limit table results with slicing or pagination.
Cache expensive statistics.
Avoid loading thousands of records into templates.
Example:
articles = Article.objects.select_related("author", "category").order_by("-created_at")[:10]For caching:
from django.core.cache import cache

stats = cache.get("dashboard_stats")

if not stats:
    stats = {
        "total_articles": Article.objects.count(),
        "published_articles": Article.objects.filter(status="published").count(),
    }
    cache.set("dashboard_stats", stats, 300)
This caches dashboard statistics for 5 minutes.
13. Recommended Dashboard Sections
A professional Django dashboard may include:
Statistic cards
Line charts
Bar charts
Pie charts
Recent activity
Searchable tables
Quick action buttons
Date filters
Status filters
Notifications
User-specific widgets
Export buttons
For example, a content dashboard could have:
Total posts
Total views
Published posts
Draft posts
Top categories
Most viewed articles
Recent comments
Pending moderation
14. Final Best Practices
A good Django dashboard should be:
Clear
Fast
Responsive
Secure
Easy to filter
Easy to maintain
Not overloaded with unnecessary data
Do not put too many charts on one page. A dashboard should help users make decisions quickly, not confuse them.
Conclusion
Building interactive dashboards in Django is a practical and powerful skill. Django gives you everything needed to collect, calculate, protect, and render data. With the ORM, you can create statistics using count, aggregate, and annotate. With templates, you can display cards, tables, and filters. With Chart.js, you can transform data into visual charts. With AJAX or HTMX, you can update parts of the dashboard without reloading the whole page.
A well-built dashboard turns raw database records into meaningful information. It helps users understand what is happening in the application and take action quickly. Whether you are building a blog platform, admin panel, SaaS app, e-commerce system, or learning platform, interactive dashboards are an essential part of professional Django development.







💬 Comments
No comments yet. Be the first to comment!
Login to comment.