Introduction
A web application can look healthy from the outside while serious problems are happening inside. The homepage may load, but checkout may be failing. The server may be online, but database queries may be slow. The API may return successful responses, but users may still experience timeouts, broken forms, or delayed background tasks.
This is why modern web applications need observability.
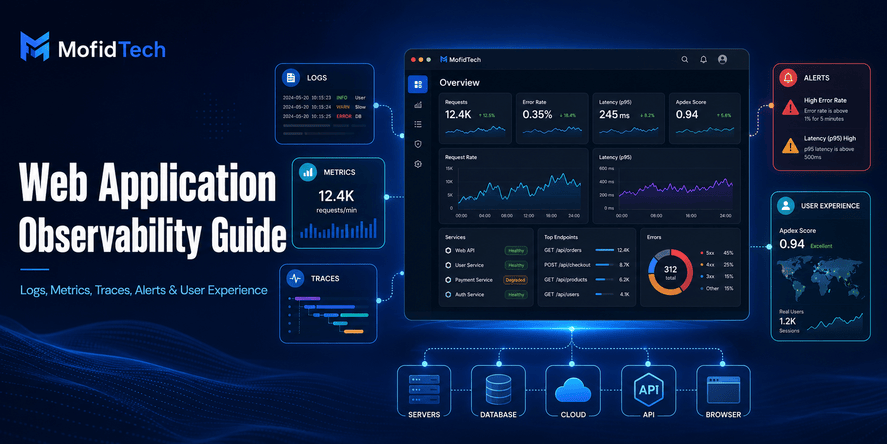
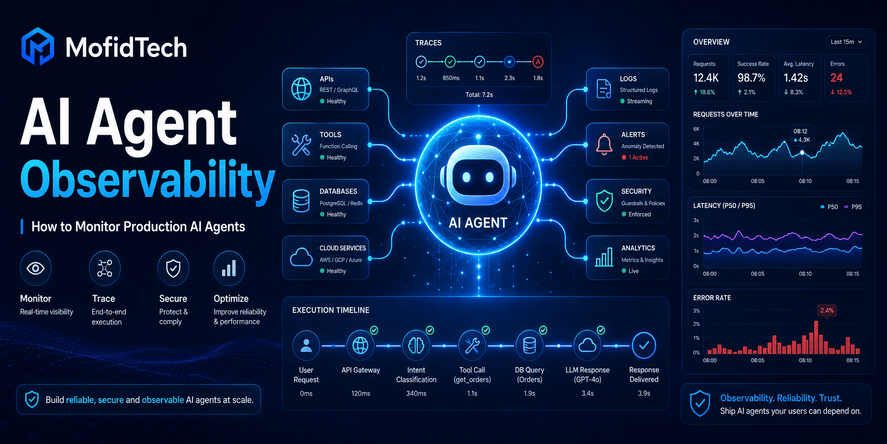
Web application observability is the ability to understand what is happening inside a production application by collecting and connecting signals such as logs, metrics, traces, alerts, errors, and user experience data. It helps developers answer practical questions quickly: What broke? When did it start? Who is affected? Why is it happening? What should we fix first?
For small teams, observability is often ignored until something fails. Many developers deploy an application, check that the server is running, and assume everything is fine. But production reliability is not only about uptime. A reliable application must also be fast, predictable, secure, understandable, and easy to troubleshoot.
This guide explains how to design practical observability for web applications without overcomplicating the process. It focuses on concepts, workflows, decisions, mistakes, and best practices rather than code. Whether you build applications with Django, Python, Node.js, Laravel, Java, Go, or another stack, the principles are the same.
Table of Contents
- What Is Web Application Observability?
- Observability vs Monitoring
- Why Logs Alone Are Not Enough
- The Five Core Signals of Web Application Observability
- Logs, Metrics, and Traces Explained Clearly
- What Should Developers Monitor in Production?
- User Experience Monitoring
- Database Observability
- API Observability
- Background Job and Queue Observability
- Alerting Strategy and Alert Fatigue
- Observability for Small Teams
- Security and Privacy Considerations
- Performance Considerations
- Troubleshooting with Observability
- Common Observability Mistakes
- Best Practices
- Practical Checklist
- Comparison Tables
- FAQ
- Conclusion
What Is Web Application Observability?
Web application observability is the practice of collecting, organizing, and analyzing signals from a web application so developers can understand its behavior in production.
A web application is observable when your team can answer questions like:
- Is the application working correctly right now?
- Are users experiencing errors?
- Which pages or API endpoints are slow?
- Is the database causing performance problems?
- Are background jobs delayed?
- Did the latest deployment introduce a problem?
- Which users, browsers, regions, or services are affected?
- Is the issue related to application code, infrastructure, database, network, third-party services, or user behavior?
Observability is not only about collecting data. It is about making production behavior understandable.
A good observability system helps developers move from guessing to knowing. Instead of saying, “Maybe the server is slow,” the team can say, “The payment confirmation endpoint became slower after the latest deployment because database response time increased and external payment provider calls are taking longer.”
That level of clarity is what makes observability valuable.
Observability vs Monitoring
Monitoring and observability are related, but they are not the same.
Monitoring tells you whether known things are healthy. Observability helps you investigate unknown problems.
Monitoring is useful when you already know what to watch. For example, you can monitor server CPU usage, memory usage, disk space, uptime, error rate, or response time. If a value crosses a threshold, you receive an alert.
Observability goes deeper. It helps you understand why something happened, especially when the problem is unexpected. It connects multiple signals so you can explore the system and find the cause.
| Concept | Main Purpose | Example Question |
|---|---|---|
| Monitoring | Detect known problems | Is the server down? |
| Observability | Understand system behavior | Why are users seeing slow checkout today? |
| Alerting | Notify the team | Should someone investigate now? |
| Logging | Record events | What happened during this request? |
| Metrics | Measure trends | Is latency increasing? |
| Tracing | Follow request flow | Which service or database call caused the delay? |
Monitoring is necessary, but observability is broader. A mature web application needs both.
Why Logs Alone Are Not Enough
Many developers start with logs. This is natural because logs are familiar and easy to understand. A log can show that a user logged in, an error happened, a payment failed, or a background task started.
But logs alone are not enough for production observability.
Logs are often too detailed, too noisy, or too disconnected. During an incident, searching through thousands of log lines can be slow and frustrating. Logs may tell you that an error happened, but they may not show whether the error affected one user or thousands. They may not reveal whether the problem is part of a wider performance issue.
Logs are useful, but they need support from metrics, traces, alerts, and user experience signals.
For example:
- Logs show that an error occurred.
- Metrics show that the error rate increased after deployment.
- Traces show which request path caused the error.
- Alerts notify the team that the issue is urgent.
- User experience monitoring shows that real users are affected.
Together, these signals create a complete picture.
The Five Core Signals of Web Application Observability
A practical web application observability strategy should include five major signal types.
1. Logs
Logs are records of events that happen inside the application. They help explain what happened at a specific moment.
Useful logs may include:
- User authentication events
- Application errors
- Payment failures
- Permission problems
- Background task failures
- Important business actions
- Security-related events
- Integration failures with external services
Logs are especially useful when they include context. A log entry is much more helpful when it includes the affected feature, request, user type, operation, environment, and severity level.
However, logs should not contain sensitive data such as passwords, secret tokens, private keys, full payment details, or unnecessary personal information.
2. Metrics
Metrics are numerical measurements collected over time. They help teams understand trends, thresholds, and system health.
Useful metrics may include:
- Request rate
- Error rate
- Response time
- Database query duration
- CPU usage
- Memory usage
- Queue length
- Failed login attempts
- Cache hit rate
- Background job duration
- Third-party service latency
Metrics are excellent for dashboards and alerts because they show whether behavior is normal or unusual.
For example, if the average response time suddenly increases from normal levels to a much slower level, metrics make the change visible immediately.
3. Traces
Traces show the path of a request through an application or distributed system.
A trace can show:
- When the request started
- Which application layer handled it
- Which database operations happened
- Which external services were called
- Which step took the longest
- Where the request failed
Traces are very useful for modern applications because a single user action may involve many components: frontend, backend, database, cache, file storage, payment provider, email service, authentication service, and background workers.
Without tracing, developers may know that a request is slow but not know why. With tracing, they can identify the slow part.
4. Alerts
Alerts notify the team when something requires attention.
A useful alert is actionable. It should indicate a real problem, provide context, and help the team decide what to do next.
Bad alerts create noise. If alerts are too frequent, unclear, or low priority, developers start ignoring them. This is called alert fatigue.
Good alerting focuses on user impact, business impact, and urgent technical risk.
5. User Experience Signals
User experience signals show how real users experience the application.
These signals may include:
- Page load time
- Failed form submissions
- Slow checkout or registration flows
- Browser errors
- Mobile performance problems
- Search failures
- Abandoned user flows
- Real user latency by location or device
- Core user journey success rate
Technical metrics may look normal while users are still unhappy. User experience monitoring helps connect technical behavior to real-world impact.
Logs, Metrics, and Traces Explained Clearly
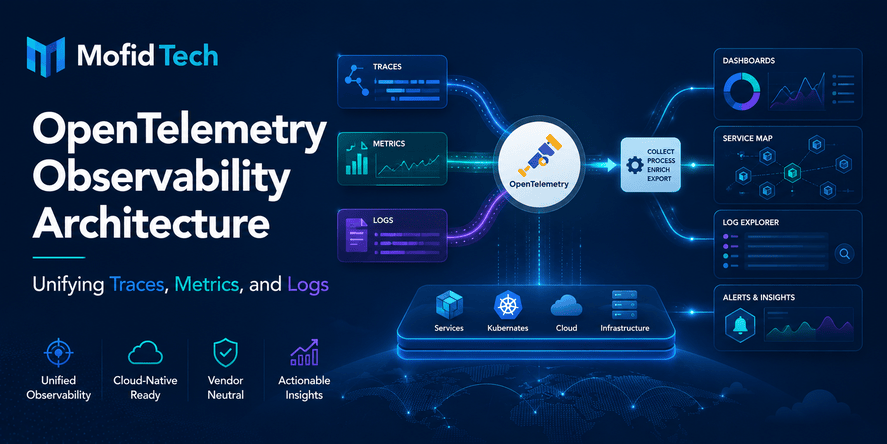
Logs, metrics, and traces are often called the three pillars of observability. Each one answers a different type of question.
Logs Answer: What Happened?
Logs are event records. They are useful when you need detail.
Example situations where logs help:
- A user cannot log in.
- A payment failed.
- A file upload was rejected.
- A permission check blocked an action.
- A background task crashed.
- A third-party API returned an error.
Logs are best for investigation after you already know where to look.
Metrics Answer: Is Something Changing?
Metrics show trends and patterns.
Example situations where metrics help:
- Error rate is increasing.
- Response time is getting slower.
- Memory usage is growing.
- Database connections are near the limit.
- Queue length is rising.
- Traffic is unusually high.
- Cache performance is decreasing.
Metrics are best for dashboards, health checks, and alerting.
Traces Answer: Where Did Time Go?
Traces show the journey of a request.
Example situations where traces help:
- A page is slow but the server looks normal.
- An API endpoint is slow only for some requests.
- A request touches multiple services.
- Database time is hidden inside application processing.
- External service calls are slowing down the user flow.
Traces are best for understanding complex request behavior.
How They Work Together
Imagine users report that checkout is slow.
Logs may show failed payment attempts. Metrics may show that response time increased during the last hour. Traces may show that the payment confirmation step is waiting too long for an external provider. User experience data may show that many users abandon checkout after waiting.
Each signal contributes part of the answer. Together, they help the team respond faster.
What Should Developers Monitor in Production?
A production web application should be monitored from multiple angles. Monitoring only the server is not enough.
Application Health
Application health shows whether the application is running and responding correctly.
Important questions:
- Is the application reachable?
- Are important pages loading?
- Are API endpoints responding?
- Are errors increasing?
- Did the latest deployment affect stability?
- Are users able to complete key actions?
Application health should focus on real behavior, not only process status. A server can be running while the application is broken.
Response Time
Response time measures how long the application takes to respond to requests.
You should watch:
- Average response time
- Slowest requests
- Response time by endpoint
- Response time after deployment
- Response time during traffic peaks
- Response time by user region or device if relevant
Slow response time can reduce user trust, increase bounce rate, and make the application feel unreliable.
Error Rate
Error rate measures how often requests fail.
You should monitor:
- Total errors
- Error percentage
- Errors by endpoint
- Errors by user action
- Errors after deployment
- Errors from third-party services
- Browser-side errors if applicable
A small number of errors may be normal. A sudden increase is usually a warning sign.
Availability and Uptime
Availability measures whether users can access the application.
However, uptime alone is not enough. A website may be technically available but functionally broken.
For example:
- The homepage loads, but login fails.
- The dashboard opens, but data does not appear.
- The product page works, but checkout fails.
- The API responds, but returns incomplete data.
Practical observability should monitor key user flows, not only basic uptime.
Database Performance
The database is often the source of web application performance problems.
Monitor:
- Slow queries
- Connection usage
- Query volume
- Locking issues
- Replication delay if applicable
- Database CPU and memory
- Disk usage
- Index effectiveness
- Transaction duration
Database observability is especially important for applications that grow over time. A query that works well with a small dataset may become slow when the database grows.
API Performance
Modern applications often depend on internal and external APIs.
Monitor:
- API response time
- API error rate
- Authentication failures
- Rate limit events
- Third-party provider failures
- Timeout events
- Payload size problems
- Endpoint usage patterns
APIs should be monitored from both technical and business perspectives. A slow API may break user experience even if the rest of the application works.
Background Jobs
Many web applications use background jobs for email sending, notifications, reports, file processing, cleanup tasks, or data synchronization.
Monitor:
- Job success rate
- Job failure rate
- Queue length
- Job duration
- Retry frequency
- Delayed jobs
- Stuck jobs
- Worker availability
A background job failure may not appear immediately to users, but it can create serious business problems. For example, users may not receive confirmation emails, invoices, password reset messages, or data updates.
Authentication and Authorization
Authentication is a critical user flow.
Monitor:
- Login failures
- Password reset failures
- Suspicious login patterns
- Account lockouts
- Permission denied events
- Session errors
- Multi-factor authentication issues if used
This is both a reliability and security concern.
Storage and File Handling
Applications that support uploads, images, documents, backups, or generated files should monitor storage behavior.
Monitor:
- Failed uploads
- Storage usage
- File processing failures
- Slow downloads
- Missing files
- Permission errors
- Backup success or failure
File-related problems are often discovered late unless they are monitored.
User Experience Monitoring
Technical observability is incomplete without user experience monitoring.
Users do not care whether CPU usage is normal. They care whether the application works for them. A good observability strategy connects backend health to user experience.
What User Experience Signals Should You Track?
Important user experience signals include:
- Page load speed
- Time to interactive
- Failed user actions
- Form submission errors
- Search failures
- Checkout abandonment
- Login failure rate
- Browser errors
- Mobile performance
- Geographic latency differences
Why User Experience Monitoring Matters
Backend dashboards may show that everything is healthy, while users still experience problems. This can happen when:
- A frontend error breaks a button.
- A third-party script slows the page.
- A specific browser has compatibility problems.
- Mobile users face layout or performance issues.
- A form validation error prevents completion.
- A CDN or network issue affects one region.
User experience monitoring helps reveal these issues.
Key User Journeys to Monitor
Every application has important user journeys. These should be monitored carefully.
Examples:
| Application Type | Key User Journeys |
|---|---|
| Blog or content website | Homepage load, article view, search, newsletter subscription |
| SaaS application | Signup, login, dashboard load, billing, core feature usage |
| E-commerce website | Product view, cart, checkout, payment, order confirmation |
| Educational platform | Login, course access, video playback, quiz submission |
| Admin dashboard | Authentication, report loading, data export, user management |
A practical rule is simple: monitor the flows that would hurt your users or business if they failed.
Database Observability
Databases are central to most web applications. When the database slows down, the entire application often feels slow.
Why Database Problems Are Common
Database issues often appear gradually. A feature may work perfectly during development but become slow in production because production data is larger, traffic is higher, and users behave differently.
Common causes include:
- Missing indexes
- Inefficient queries
- Large table scans
- Too many database connections
- Long transactions
- Locking conflicts
- Poor pagination strategy
- Expensive joins
- Uncontrolled reporting queries
- Unoptimized search filters
What to Watch in the Database
Important database observability signals include:
- Query duration
- Slowest queries
- Most frequent queries
- Connection pool usage
- Lock wait time
- Disk usage
- Index usage
- Deadlocks
- Failed transactions
- Backup status
- Replication health if used
Database Observability and User Impact
Database metrics should be connected to user impact. A slow query is more important when it affects login, checkout, dashboard loading, or content publishing.
Not every slow query deserves the same priority. The most important problems are those that affect critical workflows.
API Observability
APIs are the backbone of modern applications. They connect frontends, mobile apps, backend services, external platforms, and automation tools.
What API Observability Should Answer
A good API observability strategy should answer:
- Which endpoints are used most?
- Which endpoints are slow?
- Which endpoints fail most often?
- Are failures caused by clients, servers, or external dependencies?
- Are users hitting rate limits?
- Are authentication failures increasing?
- Are API changes breaking integrations?
- Are third-party services affecting performance?
API Metrics That Matter
Important API metrics include:
- Request count
- Response time
- Error rate
- Timeout rate
- Authentication failure rate
- Rate limit events
- Payload size
- Endpoint popularity
- External dependency latency
API Observability for Developers
Developers should use API observability to improve reliability and design better interfaces. If an endpoint is slow, confusing, or frequently misused, observability can reveal the problem.
API observability is not only for incident response. It also helps improve product design, documentation, performance, and security.
Background Job and Queue Observability
Background jobs are easy to forget because they do not always affect users immediately. But when they fail, they can create serious hidden problems.
Examples of Background Jobs
Common background jobs include:
- Sending emails
- Generating reports
- Processing images
- Importing data
- Synchronizing records
- Clearing expired sessions
- Running scheduled maintenance
- Updating search indexes
- Sending notifications
- Processing payments asynchronously
What to Monitor
For background jobs, monitor:
- Queue length
- Oldest pending job
- Failed jobs
- Retry count
- Job duration
- Worker availability
- Delayed execution
- Repeated failures
- Jobs stuck in progress
Why Queue Length Matters
Queue length is an important early warning signal. If the queue grows faster than workers can process it, users may experience delays.
For example:
- Password reset emails may arrive late.
- Invoices may not be generated.
- Notifications may be delayed.
- Reports may remain pending.
- Uploaded files may not be processed.
A growing queue is not always an emergency, but it should be visible.
Alerting Strategy and Alert Fatigue
Alerts are useful only when they lead to action. Too many alerts create noise. Too few alerts allow serious problems to continue unnoticed.
What Makes an Alert Useful?
A useful alert should be:
- Important
- Actionable
- Clear
- Timely
- Connected to user impact
- Routed to the right person or team
- Supported by enough context for investigation
An alert should answer: What is wrong, why does it matter, and what should someone check first?
Bad Alert Examples
Bad alerts often have these problems:
- They trigger too often.
- They are too vague.
- They do not indicate severity.
- They are based on harmless temporary spikes.
- They alert on symptoms that no one can act on.
- They wake people up for non-urgent issues.
- They do not include useful context.
Good Alert Examples
Good alerts focus on meaningful problems:
- Error rate is unusually high for a critical endpoint.
- Login failures increased sharply.
- Checkout success rate dropped.
- Database connections are near exhaustion.
- Background jobs are delayed beyond an acceptable threshold.
- Disk usage is close to a dangerous level.
- A key third-party service is timing out.
- User-facing response time is above an acceptable limit.
Severity Levels
A simple severity model can help teams respond correctly.
| Severity | Meaning | Example |
|---|---|---|
| Critical | Immediate user or business impact | Application unavailable, checkout failing |
| High | Serious degradation | High error rate, database near limit |
| Medium | Needs attention soon | Queue delay, repeated non-critical failures |
| Low | Informational or maintenance issue | Minor warning, unusual but safe trend |
Not every issue should wake someone up. Alerting should match business impact.
Observability for Small Teams and Solo Developers
Small teams often think observability is only for large companies. This is a mistake.
A small application does not need a complex observability platform from day one, but it does need basic visibility. Without it, every production issue becomes a guessing game.
Start Simple
A small team can start with:
- Basic uptime monitoring
- Error tracking
- Application logs
- Response time metrics
- Database performance checks
- Email delivery monitoring
- Backup monitoring
- Alerts for critical failures
- Simple dashboards for key indicators
The goal is not to monitor everything. The goal is to monitor what matters.
Avoid Overengineering
A small team should avoid building a complicated observability setup before the application needs it.
Common overengineering mistakes include:
- Too many dashboards
- Too many alerts
- Collecting data no one uses
- Tracking low-value metrics
- Using expensive tools without clear need
- Ignoring basic user journey monitoring
- Spending more time on dashboards than application reliability
Good observability should reduce confusion, not create more work.
Practical First Step
The best first step is to define your critical user journeys.
Ask:
- What must work every day?
- What user actions are most important?
- What failures would damage trust?
- What problems would cost money?
- What issues would require immediate action?
Then monitor those areas first.
Security and Privacy Considerations
Observability can improve security, but it can also create privacy risks if implemented carelessly.
Do Not Log Sensitive Data
Logs should never contain sensitive information that does not need to be stored.
Avoid logging:
- Passwords
- Secret tokens
- Private keys
- Full credit card details
- Sensitive identity documents
- Full session values
- Unnecessary personal information
- Private user messages unless required and protected
- Security answers or recovery codes
A log system can become a security liability if it stores sensitive data.
Protect Observability Dashboards
Monitoring dashboards often reveal internal system details. They may show infrastructure names, endpoint patterns, error messages, user identifiers, traffic volume, and security events.
Access should be limited to trusted team members. Dashboards should not be publicly accessible.
Monitor Security Events
Security-related observability can help detect suspicious behavior.
Useful security signals include:
- Repeated failed logins
- Password reset abuse
- Permission denied spikes
- Suspicious API usage
- Unusual traffic patterns
- Unexpected admin actions
- Rate limit events
- Unusual geographic access
- Account enumeration attempts
- Unauthorized access attempts
Security monitoring should be carefully designed to avoid both blind spots and unnecessary privacy exposure.
Balance Visibility and Privacy
The goal is to understand system behavior without collecting more personal data than necessary. Observability should support reliability and security while respecting user privacy.
Performance Considerations
Observability should help performance, not harm it.
Observability Has a Cost
Collecting logs, metrics, traces, and user experience data requires storage, processing, network usage, and sometimes application overhead.
If observability is poorly designed, it can create problems:
- Excessive log volume
- High monitoring costs
- Slower application performance
- Too much data to analyze
- Storage growth
- Dashboard clutter
- Increased complexity
Focus on Useful Data
More data is not always better. Useful data is better.
Collect information that helps answer real questions. Avoid collecting large volumes of low-value data.
Sampling Can Help
For high-traffic applications, tracing every request may be expensive. Sampling can reduce cost while still providing useful insight.
However, critical errors and important user journeys should receive higher visibility.
Watch Monitoring Costs
Observability tools can become expensive as traffic grows. Teams should monitor:
- Log volume
- Trace volume
- Data retention period
- Number of monitored services
- Alert volume
- Dashboard usage
- Storage cost
A practical observability strategy includes cost awareness.
Troubleshooting with Observability
Observability is most valuable during troubleshooting. It helps teams move from symptoms to root causes.
A Practical Troubleshooting Workflow
When a production issue appears, follow a structured approach:
- Confirm the user impact.
- Identify when the problem started.
- Check recent deployments or changes.
- Review error rate and response time metrics.
- Look at affected endpoints or user journeys.
- Check logs for related errors.
- Use traces to identify slow or failing components.
- Review database and external service behavior.
- Apply a fix or rollback if needed.
- Document the cause and prevention steps.
This workflow reduces panic and improves decision-making.
Example Scenario: Slow Dashboard
A dashboard becomes slow after a new feature is released.
Metrics show response time increased. Logs show no obvious application errors. Traces reveal that dashboard requests now spend most of their time waiting for database results. Database metrics show a specific query is expensive when users have many records.
The team now knows the problem is not the server, not the network, and not the frontend. It is a database performance issue connected to the new feature.
Example Scenario: Users Not Receiving Emails
Users report that password reset emails are delayed.
Application uptime looks normal. Error rate is low. Queue monitoring shows a growing number of pending email jobs. Worker metrics show that job processing slowed after a configuration change. Logs show repeated email provider timeouts.
The issue is not the password reset form itself. It is the background email delivery workflow.
Example Scenario: Checkout Failures
Users report payment problems.
Metrics show a rise in checkout errors. Logs show payment confirmation failures. Traces show long waiting time from a third-party payment service. User journey monitoring shows increased checkout abandonment.
The team can respond by communicating the issue, adjusting retry behavior, monitoring provider status, and protecting the user experience.
Common Observability Mistakes
Mistake 1: Monitoring Only Server Uptime
A server can be online while the application is broken. Monitoring should include key user flows, errors, performance, database health, and background jobs.
Mistake 2: Ignoring User Experience
Backend systems may look healthy while users face browser errors, slow pages, or broken forms. Real user experience should be part of observability.
Mistake 3: Creating Too Many Alerts
Too many alerts create alert fatigue. Teams begin ignoring notifications, including important ones. Alerts should be meaningful and actionable.
Mistake 4: Logging Sensitive Data
Logs are often copied, searched, exported, and retained. Sensitive data in logs increases security and privacy risk.
Mistake 5: No Deployment Visibility
Teams should be able to connect incidents to deployments. If performance or errors change after a release, observability should make that visible.
Mistake 6: No Database Monitoring
Many application problems are database problems. Ignoring database observability leaves a major blind spot.
Mistake 7: No Background Job Monitoring
Background failures can silently damage the product. Delayed emails, failed reports, and stuck imports may not appear in normal page monitoring.
Mistake 8: Dashboards No One Uses
A dashboard is useful only if it supports decisions. Too many charts without clear purpose create confusion.
Mistake 9: Treating Observability as a Tool Instead of a Practice
Buying a monitoring tool does not automatically create observability. Teams need good questions, useful signals, clear ownership, and incident workflows.
Best Practices for Web Application Observability
Start with User Impact
Begin with the question: What problems would users notice?
Monitor the flows that matter most:
- Signup
- Login
- Search
- Checkout
- Dashboard loading
- Form submission
- Payment
- File upload
- Password reset
- Admin publishing
- API access
User impact should guide monitoring priorities.
Use Clear Naming
Metrics, logs, alerts, and dashboards should use clear names. Confusing names slow down incident response.
A developer should quickly understand what a signal means and why it matters.
Add Context to Logs
Logs are more useful when they include context such as:
- Feature area
- Operation type
- Severity
- Request context
- Environment
- Error category
- A safe identifier for correlation
Do not include sensitive data. The goal is useful context, not excessive detail.
Monitor Trends, Not Only Single Events
A single error may not matter. A rising error rate does.
A slow request may not matter. A pattern of increasing latency does.
Observability should show trends so teams can detect problems early.
Connect Technical Metrics to Business Flows
Technical metrics become more valuable when connected to business or user flows.
For example:
- Login error rate affects access.
- Checkout latency affects revenue.
- Search failure affects discovery.
- Email delivery delay affects account recovery.
- Dashboard slowness affects productivity.
This helps teams prioritize what matters.
Review Alerts Regularly
Alerts should be reviewed and improved.
Ask:
- Did this alert help?
- Was it too noisy?
- Was it too late?
- Did it reach the right person?
- Was the message clear?
- Did it include enough context?
- Should the threshold change?
Alerting should evolve with the application.
Keep Incident Notes
After important incidents, document:
- What happened
- Who was affected
- When it started
- How it was detected
- What fixed it
- What will prevent it
- Which observability gaps were discovered
Incidents should improve the system.
Practical Web Application Observability Checklist
Pre-Production Checklist
Before launching a web application, make sure you have visibility into:
- Application uptime
- Important pages or endpoints
- Error tracking
- Response time
- Database health
- Background job status
- Email delivery
- Disk and storage usage
- Security-related events
- Backup success
- Deployment history
- Critical user journeys
Post-Deployment Checklist
After each deployment, check:
- Did error rate increase?
- Did response time change?
- Are key pages working?
- Are key API endpoints healthy?
- Are background jobs processing normally?
- Are logs showing new warnings?
- Are users completing important flows?
- Are database queries slower than before?
- Are external services responding normally?
Incident Response Checklist
During an incident, check:
- What is the user impact?
- When did the issue start?
- What changed recently?
- Which users or features are affected?
- Are errors increasing?
- Are response times increasing?
- Are database metrics abnormal?
- Are background jobs delayed?
- Are third-party services failing?
- Is a rollback needed?
- What should be documented afterward?
Small Team Starter Checklist
For a small team or solo developer, start with:
- Uptime monitoring
- Error tracking
- Basic application logs
- Slow request visibility
- Database performance visibility
- Email delivery monitoring
- Backup monitoring
- Alerts for critical failures
- A simple production health dashboard
This is enough to avoid many common blind spots.
Comparison Tables
Logs vs Metrics vs Traces
| Signal | Best For | Weakness |
|---|---|---|
| Logs | Detailed event investigation | Can become noisy and hard to search |
| Metrics | Trends, dashboards, alerts | May not explain root cause alone |
| Traces | Request flow and performance bottlenecks | Can be complex or costly at scale |
Technical Monitoring vs User Experience Monitoring
| Area | Technical Monitoring | User Experience Monitoring |
|---|---|---|
| Focus | System behavior | Real user impact |
| Examples | CPU, memory, errors, response time | Page speed, failed forms, checkout abandonment |
| Main Question | Is the system healthy? | Are users successful? |
| Risk if Ignored | Hidden infrastructure problems | Users suffer while dashboards look normal |
Basic vs Advanced Observability
| Level | What It Includes | Best For |
|---|---|---|
| Basic | Uptime, errors, logs, simple alerts | Small websites and early-stage projects |
| Intermediate | Metrics, dashboards, database monitoring, user flow checks | Growing web applications |
| Advanced | Distributed tracing, real user monitoring, service maps, anomaly detection | Complex systems and larger teams |
Observability Architecture Without Overcomplication
A practical observability architecture does not need to be complicated. It should answer real operational questions.
Layer 1: Application Layer
This includes logs, errors, response times, request volume, endpoint behavior, and important business events.
The application layer helps developers understand what the software is doing.
Layer 2: Infrastructure Layer
This includes server resources, containers, memory, CPU, disk, network, and process health.
The infrastructure layer helps teams understand whether the environment is stable.
Layer 3: Database Layer
This includes slow queries, connection usage, locks, disk growth, and transaction behavior.
The database layer helps teams find performance and data reliability issues.
Layer 4: External Dependency Layer
This includes payment providers, email services, cloud storage, authentication providers, analytics tools, and third-party APIs.
The dependency layer helps teams understand whether an external service is affecting the application.
Layer 5: User Experience Layer
This includes page performance, browser errors, failed actions, and key user journey completion.
The user experience layer helps teams understand whether the application is successful from the user’s point of view.
How to Build an Observability Mindset
Observability is not only a technical setup. It is a mindset.
A team with an observability mindset asks better questions before problems happen:
- How will we know if this feature breaks?
- How will we know if users cannot complete this action?
- How will we detect slow performance?
- How will we connect errors to deployments?
- How will we know whether a database change caused problems?
- How will we detect abuse or suspicious behavior?
- How will we investigate issues quickly?
This mindset improves software design. Developers begin building features that are easier to operate, not only easier to develop.
Observability and Deployment Reliability
Every deployment changes the production system. Observability helps teams detect whether a deployment introduced a problem.
After deployment, teams should watch:
- Error rate
- Response time
- Logs
- Key user journeys
- Database behavior
- Background jobs
- API behavior
- Resource usage
- User complaints or support tickets
A deployment is not complete when the application starts. It is complete when the application is confirmed healthy in production.
Observability and Product Quality
Observability is not only for technical teams. It can improve product quality.
For example:
- If users abandon a form, the product may be confusing.
- If search returns many empty results, content or indexing may need improvement.
- If users repeatedly trigger validation errors, the interface may need better guidance.
- If a dashboard is often slow, the product experience may need redesign.
- If users retry the same action many times, the workflow may not be clear.
Observability can reveal product friction, not only technical failure.
Observability and SEO
For content websites, blogs, documentation platforms, and technical websites like MofidTech, observability can also support SEO.
Search performance depends partly on site reliability and user experience. A website that is frequently slow, unavailable, or broken may lose user trust and search visibility.
Important SEO-related signals to monitor include:
- Page load speed
- Server response time
- Error pages
- Broken internal links
- Failed image loading
- Redirect problems
- Mobile usability issues
- Search page behavior
- Content publishing errors
- Sitemap and crawl accessibility
- High bounce pages caused by performance issues
Observability helps technical SEO because it shows how the website behaves in real production conditions.
FAQ: Web Application Observability
1. What is web application observability?
Web application observability is the ability to understand what is happening inside a production web application by collecting and connecting logs, metrics, traces, alerts, errors, and user experience signals. It helps developers detect problems, investigate root causes, and improve reliability.
2. What is the difference between monitoring and observability?
Monitoring detects known problems by watching predefined signals such as uptime, error rate, and response time. Observability helps investigate unknown problems by connecting multiple signals and explaining why the application behaves a certain way.
3. What are the three pillars of observability?
The three traditional pillars of observability are logs, metrics, and traces. Logs explain what happened, metrics show trends over time, and traces reveal how a request moves through the system.
4. Are logs enough for web application observability?
No. Logs are useful, but they are not enough alone. A complete observability strategy also needs metrics, traces, alerts, error tracking, database visibility, background job monitoring, and user experience signals.
5. What should I monitor first in a web application?
Start by monitoring uptime, error rate, response time, key user journeys, database performance, background jobs, and critical integrations such as email or payment services. Focus first on the features users depend on most.
6. Do small web applications need observability?
Yes. Small applications do not need complex observability systems, but they still need basic visibility. Even a small website should know when it is down, when errors increase, when pages become slow, and when critical user actions fail.
7. What is alert fatigue?
Alert fatigue happens when teams receive too many alerts, especially low-value or unclear alerts. Over time, developers start ignoring alerts, which increases the risk of missing serious incidents.
8. How can I reduce alert fatigue?
Reduce alert fatigue by creating alerts only for meaningful, actionable problems. Focus on user impact, clear severity levels, useful context, and thresholds that avoid unnecessary noise.
9. Why are traces useful?
Traces are useful because they show where time is spent during a request. They help developers identify whether slowness comes from application logic, database queries, external services, cache, or another component.
10. What is user experience monitoring?
User experience monitoring tracks how real users experience the application. It can reveal slow pages, browser errors, failed forms, abandoned workflows, and problems that backend monitoring may not detect.
11. What is the most common observability mistake?
One of the most common mistakes is monitoring only server uptime. A server can be online while important application features are broken. Practical observability must include user journeys, errors, performance, database health, and background jobs.
12. How does observability improve reliability?
Observability improves reliability by helping teams detect issues earlier, understand root causes faster, prioritize user-impacting problems, reduce downtime, and prevent repeated incidents.
Conclusion
Web application observability is no longer optional for serious production systems. It is a practical requirement for building reliable, secure, and user-friendly applications.
Good observability does not mean collecting every possible signal. It means collecting the right signals and connecting them to real questions: Is the application working? Are users affected? What changed? Where is the bottleneck? What should we fix first?
Logs, metrics, traces, alerts, and user experience monitoring each provide part of the answer. Together, they help developers understand production behavior clearly and respond to problems with confidence.
For small teams, the best approach is to start simple. Monitor critical user journeys, track errors, watch response time, check database health, observe background jobs, and create alerts that matter. As the application grows, observability can become more advanced.
The most important principle is this: production should not be a mystery. A well-designed observability strategy turns hidden problems into visible signals and helps teams build better software.

💬 Comments
No comments yet. Be the first to comment!
Login to comment.