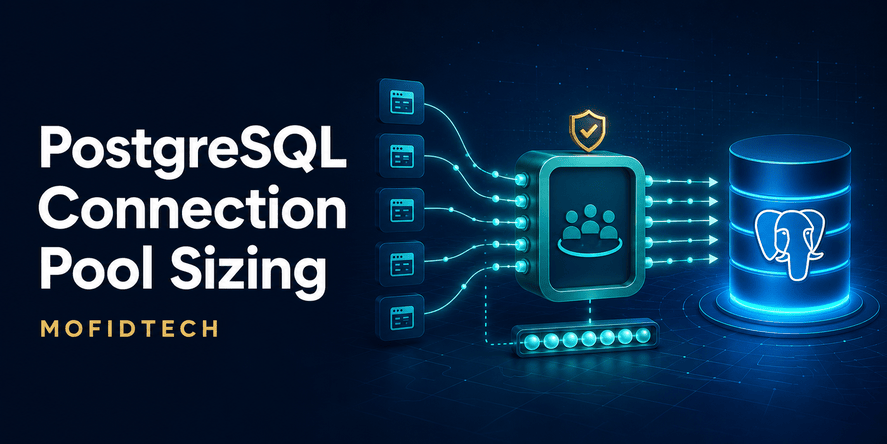
How to Size PostgreSQL Connection Pools Without Overloading Your Database
Quick answer: A safe pool is not the largest number your database will accept. It is a controlled concurrency limit that leaves capacity for administration, maintenance, failover, background work, and bursts while keeping the database busy enough to meet latency and throughput goals.
PostgreSQL connection pooling is often introduced as a performance optimization, but in production it is equally a capacity-control and reliability mechanism. A pool reuses established database connections, limits how many requests can compete inside PostgreSQL at once, and places excess demand in a queue where it can be measured and controlled. The hard part is not enabling a pool. The hard part is sizing every pool across every process, service, replica, job runner, and region so their combined demand does not exceed the database connection budget.
This guide explains a no-code method for making that decision. It separates client connections from server connections, shows why database limits are not throughput targets, compares application, external, and managed pooling, and provides a rollout and troubleshooting framework. The goal is not a universal magic number. The goal is a defensible range that can be validated with real workload measurements.
Table of Contents
- 1. What connection pooling solves
- 2. The connection layers you must count
- 3. Why max_connections is not a performance target
- 4. Build a database connection budget
- 5. Profile the workload before choosing a size
- 6. Choose the right pooling layer and mode
- 7. A step-by-step sizing workflow
- 8. Architecture-specific guidance
- 9. Timeouts, queueing, and backpressure
- 10. Compatibility, security, and observability
- 11. Troubleshooting and common mistakes
- 12. Rollout checklist, FAQ, and conclusion
1. What PostgreSQL Connection Pooling Actually Solves
A connection is a resource, not a free handle
A database connection represents authenticated state, network state, and server-side resources. Establishing one can involve network negotiation, Transport Layer Security, authentication, session initialization, and backend resource allocation. Repeating that setup for every small request adds latency and produces connection churn. Keeping too many sessions open, however, also has a cost. Idle sessions consume capacity, and active sessions can multiply contention for CPU, memory, storage, locks, and internal coordination.
Pooling balances those two problems. Instead of forcing every request to create a new database session, a bounded set of reusable connections serves many requests over time. When all server connections are busy, additional work waits outside the database instead of immediately creating more database processes. That queue is not automatically a failure. A short, observable queue is often safer than allowing uncontrolled concurrency to push the database into global slowdown.
Pooling improves three different things
- Connection reuse reduces repeated setup cost, which is especially useful for frequent, short transactions.
- Concurrency control prevents every application worker from opening a server connection simultaneously.
- Load shaping turns sudden demand into bounded work plus a queue, giving the database a chance to remain responsive.
Pooling does not fix inefficient work
A pool cannot make a slow query efficient, remove lock contention, repair missing indexes, reduce oversized transactions, or compensate for insufficient compute and storage. A badly sized pool can hide a query problem temporarily by restricting concurrency, but the queue will reveal the unresolved work. Conversely, increasing the pool may reduce waiting while making query latency worse because more work competes for the same database resources.
Key distinction: Treat connection pool sizing and query optimization as related but separate disciplines. The pool controls how much work enters PostgreSQL; query and schema design determine how efficiently that work finishes.
2. Count the Connection Layers Before You Size Anything
Client connections and server connections are different
A client connection is a connection from an application or tool to a pooler. A server connection is a connection from that pooler to PostgreSQL. In direct application pooling, one application connection usually corresponds to one PostgreSQL session while it remains open. In an external or managed pooler, many client sessions may share a smaller set of PostgreSQL server connections, depending on the pooling mode and session behavior.
This distinction explains why a pooler can accept many clients without allowing the same number of sessions into PostgreSQL. PgBouncer, for example, separately defines maximum client connections and the maximum server connections for a user/database pair. Cloud-managed poolers expose similar concepts. Capacity planning must therefore track both the admission limit at the pooler and the backend limit at PostgreSQL.
The multiplication effect
The most common sizing error is to inspect one process and ignore the fleet. If every application process owns a local pool, the potential database demand equals the pool cap multiplied by the total number of processes across all replicas. Background workers, scheduled jobs, administrative tools, migrations, monitoring, and emergency access add more demand. Autoscaling makes the upper bound dynamic, so a deployment can be safe at normal replica count and unsafe during a traffic surge.
| Layer | What to count | Why it matters |
|---|---|---|
| Application instances | Maximum replicas in every region or cluster | Autoscaling multiplies local pools. |
| Processes and workers | Web workers, async workers, job runners, schedulers | Each process may own an independent pool. |
| Services | Every microservice and internal tool using the database | Small pools add up across service boundaries. |
| Poolers | Application pools, PgBouncer layers, and managed proxies | Multiple layers can create hidden queues and limits. |
| Direct users | Migrations, dashboards, analysts, monitoring, and operations | These sessions need protected capacity during incidents. |
| Database roles and databases | Distinct user/database pairs | Some poolers create separate backend pools for each pair. |
3. Why max_connections Is Not Your Performance Target
PostgreSQL defines max_connections as the maximum number of concurrent connections the server accepts. The current PostgreSQL 18 documentation notes that the default is typically 100 and that increasing the value increases the allocation of certain resources, including shared memory. This makes max_connections a hard admission ceiling, not a recommendation to keep that many sessions active and not proof that the database can execute that many queries efficiently at once.
Connection capacity and work capacity are not identical
A database may accept a large number of idle sessions while performing poorly with a much smaller number of simultaneously active, CPU-heavy or I/O-heavy queries. The useful concurrency level depends on transaction duration, query mix, data access patterns, cache behavior, storage latency, CPU count, lock contention, and latency objectives. Therefore, pool size should be derived from observed work capacity and service-level goals, then constrained by the connection budget.
Always preserve emergency access
PostgreSQL supports reserved connection slots for privileged access, including superuser-reserved capacity. Operationally, teams should preserve enough headroom for monitoring, diagnosis, maintenance, migrations, replication-related tasks where applicable, and emergency intervention. A database that runs at its connection ceiling during normal traffic is difficult to recover because the people and systems needed to diagnose it may be unable to connect.
4. Build a Database Connection Budget
Start with the server limit, then subtract protected capacity
A connection budget is the maximum number of PostgreSQL server sessions that ordinary application traffic may consume. Begin with the database limit, then subtract capacity that must remain outside the application pool. Protected capacity usually includes administrative access, monitoring, migrations and deployment tasks, maintenance operations, replication or platform functions, and a safety margin for unexpected behavior.
Planning model: Application server-connection budget = database connection limit - reserved operational capacity - non-application demand - safety margin. This is a planning relationship, not a universal formula: every term must reflect the actual platform and workload.
Allocate budgets by workload, not by organizational politics
After calculating the shared application budget, divide it among services and workload classes. Interactive web requests usually need predictable latency. Background jobs may tolerate waiting but can create large bursts. Reporting and analytics may hold connections longer. Migrations are rare but operationally critical. Assigning every service the same pool size is simple, yet it ignores how long each service holds a connection and how much database work it performs.
| Budget category | Planning question | Typical control |
|---|---|---|
| Interactive traffic | How much concurrency is needed to meet user-facing latency? | Bounded pool plus short acquisition timeout. |
| Background jobs | Can work queue outside the database and retry safely? | Separate, smaller pool and worker concurrency cap. |
| Reporting | Are queries long-running or resource intensive? | Dedicated role, pool, replica, or time window. |
| Operations | Can engineers and automation connect during saturation? | Protected capacity outside normal app pools. |
| Safety margin | What absorbs autoscaling races, failover, and estimation error? | Unallocated backend capacity. |
Worst-case demand matters more than average use
Average connection usage is useful for cost and efficiency analysis, but outages usually occur at peaks: deployment restarts, synchronized job schedules, failed downstream dependencies, autoscaling bursts, retries, or failover. Calculate the configured maximum across the fleet, then compare it with the backend budget. If configured demand is several times the budget, ensure an external pooler or another admission-control layer deliberately absorbs that oversubscription. Otherwise the database is relying on timing luck.
5. Profile the Workload Before Choosing a Pool Size
Measure how long connections are actually held
Request rate alone does not determine pool demand. A service handling many requests may need few connections if each transaction is short and most request time is spent outside the database. A lower-volume service may need more concurrency if it holds sessions during remote calls, large result processing, lock waits, or long transactions. Measure connection checkout duration, transaction duration, active query duration, and time spent waiting for a connection separately.
Identify the dominant constraint
If the database CPU is saturated while the pool queue grows, adding connections is unlikely to help. If CPU and storage are underused, queries are fast, and requests spend meaningful time waiting for a connection, a modest increase may improve throughput. If lock waits dominate, more concurrent sessions can worsen the problem. If connection setup time dominates short-lived workloads, pooling or reusing connections may improve latency without increasing backend concurrency.
Use percentiles and peak windows
Averages hide overload. Evaluate connection utilization, acquisition wait time, query latency, transaction duration, and error rate at useful high percentiles during peak intervals. Review both typical peaks and exceptional events such as deployments, imports, scheduled reports, and traffic campaigns. Capacity decisions should protect the service at the load level it promises to support, not only at its daily average.
Separate active, idle, and waiting states
A high total connection count can mean very different things. Many idle connections may indicate oversized local pools. Many active connections with rising latency may indicate excessive concurrency or a resource bottleneck. Many clients waiting at the pooler may indicate intentional backpressure, insufficient capacity, or slow database work. Diagnose the state distribution before changing limits.
6. Choose the Right Pooling Layer
| Approach | Best fit | Main advantage | Main risk |
|---|---|---|---|
| Application pool | Small or stable deployments with few processes | Simple, close to application metrics and behavior | Pool caps multiply across replicas and services. |
| External pooler | Multi-process, containerized, or self-managed PostgreSQL fleets | Central backend limit and connection multiplexing | Requires operations, compatibility testing, and monitoring. |
| Managed proxy or pooler | Supported cloud databases and serverless workloads | Managed scaling, authentication integration, and surge handling | Provider limits, cost, session pinning, and feature constraints. |
| Direct connections | Administrative tools and carefully bounded special workloads | Full session semantics and minimal intermediary behavior | No central protection against connection bursts. |
Application-level pooling
Application pools are usually the first layer. They are easy to configure and can expose checkout timing directly to application monitoring. They work well when the number of processes and replicas is bounded. The challenge appears when every process maintains its own minimum and maximum. A fleet with many small pools can create a large combined ceiling, and autoscaling can expand it faster than the database can respond.
External pooling with PgBouncer
An external pooler creates a shared admission point between clients and PostgreSQL. PgBouncer distinguishes client limits from backend pool sizes and can limit connections by user/database pair, database, or user. This lets a large client population share fewer server sessions. It is particularly useful when many processes or containers connect to the same PostgreSQL service. It also introduces a component that must be secured, monitored, deployed for availability, and tested against application session behavior.
Managed pooling and database proxies
Cloud providers increasingly offer managed connection pooling or proxy services. AWS states that RDS Proxy maintains a connection pool, reuses connections, queues or throttles excess demand, and can preserve application connections during failover. Google Cloud documents managed pooling for short-lived connections and connection surges, while warning that long-lived workloads may see less benefit. Managed services can reduce operational burden, but they do not eliminate the need to size backend capacity and understand queueing, pinning, authentication, compatibility, and pricing.
7. Choose a Pooling Mode Deliberately
| Mode | Connection released | Strength | Compatibility concern |
|---|---|---|---|
| Session | When the client disconnects | Preserves session state and broad PostgreSQL behavior | Lower reuse; one long client session occupies one server connection. |
| Transaction | When each transaction completes | Strong multiplexing for short transactional workloads | Session-level state and some features need careful review. |
| Statement | After each statement | Maximum theoretical reuse for narrow workloads | Multi-statement transactions are incompatible; rarely the safest default. |
Session pooling favors compatibility
Session pooling keeps a server connection assigned for the lifetime of the client session. It behaves more like a direct connection and is easier for applications that rely on session state. Its efficiency is limited when clients are long-lived but spend much of their time idle, because the server connection cannot be reused by another client until the session ends.
Transaction pooling favors reuse
Transaction pooling returns the server connection after a transaction. This allows many client sessions to share a smaller backend pool and is often effective for high-volume web workloads with short, self-contained transactions. The application must not assume that session state remains attached to the same backend between transactions. Teams should inventory session-specific settings, temporary objects, advisory locks, notification patterns, prepared-statement behavior, and driver expectations before adoption.
Statement pooling is specialized
Statement pooling releases the server connection after every statement and therefore restricts transaction semantics. It should be considered only for narrowly defined workloads that have been tested against those restrictions. For most production web applications, the practical decision is between session and transaction pooling.
8. A Step-by-Step Connection Pool Sizing Workflow
- Inventory every connection source. List all services, replicas, processes, web workers, background workers, scheduled jobs, reporting tools, monitoring systems, migrations, and direct operational users. Include maximum autoscaling values and secondary regions.
- Establish the database server limit and protected capacity. Confirm the platform-specific connection ceiling, reserved slots, platform overhead, and operational requirements. Define a safety margin that normal application pools cannot consume.
- Calculate configured fleet demand. Multiply each per-process pool cap by the maximum number of processes and replicas, then add non-pooled and direct demand. Do this separately for normal scale, maximum autoscale, deployment overlap, and failover scenarios.
- Measure observed demand. Capture active connections, idle connections, checkout wait, transaction duration, query latency, lock waits, CPU, memory, and storage behavior during representative peaks.
- Choose the pooling boundary. Decide whether local pools alone can safely enforce the shared budget or whether a central external or managed layer is needed to multiplex clients and cap backend sessions.
- Assign service budgets. Give latency-sensitive and operational workloads explicit shares. Keep batch and reporting workloads from consuming all interactive capacity. Avoid allocating the entire backend budget on paper.
- Select a conservative initial range. Start with enough concurrency to exercise the database without assuming that every connection slot must be used. The best starting point is a test range, not a single unchangeable number.
- Load test with realistic work. Preserve transaction mix, query distribution, data volume, think time, cache behavior, and external dependencies. Increase offered load and pool size separately so their effects are distinguishable.
- Find the knee of the curve. Observe where throughput stops improving, database resource saturation rises, or latency and lock waits increase disproportionately. A pool above that point usually adds contention rather than useful capacity.
- Roll out gradually and retain rollback. Apply changes to a limited slice, watch acquisition wait, active sessions, database saturation, and errors, then expand. Keep the previous setting and a clear reversal procedure.
How to interpret load-test results
| Observation | Likely interpretation | Next decision |
|---|---|---|
| Pool wait falls and throughput rises; database remains healthy | The old pool was restrictive | Test a modestly larger value and confirm stability. |
| Pool wait falls but query latency rises sharply | More work entered than the database handles efficiently | Reduce concurrency or remove the bottleneck. |
| Pool wait rises while CPU and storage are saturated | The queue reflects a real database capacity limit | Optimize work, scale resources, or shed/defer load. |
| Connections are mostly idle | Pools or minimum sizes may be oversized | Reduce idle footprint and validate cold-start behavior. |
| Lock waits rise with pool size | Concurrency is amplifying contention | Shorten transactions and reduce conflicting work. |
9. Architecture-Specific Sizing Guidance
Traditional monoliths
A monolith with a stable number of processes is the easiest environment to reason about. Count the maximum application processes and their pool caps, then preserve capacity for jobs and operations. Local application pooling may be sufficient if the process count is small, deployments do not create large overlap, and autoscaling is bounded. Watch for separate pools in web, task, scheduler, and administration processes.
Microservices
Microservices create a portfolio allocation problem. Every service team can choose a reasonable local pool that becomes unreasonable in aggregate. Use a central connection budget, service-level allocations, ownership, and alerts for configured maximums. Consider an external or managed pooler when many services connect to the same PostgreSQL cluster. Separate critical interactive paths from best-effort jobs so one service cannot consume the entire database budget.
Containers and Kubernetes
Replica count, process count per container, rolling-update overlap, and autoscaling ceilings all affect connection demand. A deployment may temporarily run old and new replicas together, which can double one service’s configured demand. Node disruption or restart waves can also synchronize reconnections. Pooling should be paired with gradual startup, bounded retries, readiness checks that do not create connection storms, and explicit maximum replica assumptions.
Serverless and scale-to-zero platforms
Serverless environments can create many short-lived execution contexts and sudden connection bursts. A tiny local pool in each context may still produce a large fleet total. Central managed or external pooling is often valuable because it separates a large, elastic client population from a bounded set of database sessions. The design still needs acquisition timeouts, retry limits, and a maximum client demand strategy; otherwise the queue simply moves to another layer and grows without control.
High availability and failover
Failover changes capacity and connection behavior at the same time. Clients reconnect, in-flight transactions fail, pools refill, and the replacement database may have different warm-cache behavior. Test whether the pooler preserves or recreates client connections, how quickly it drains invalid sessions, and whether reconnection backoff prevents a surge. Reserve headroom for recovery rather than sizing only for steady state.
Read replicas and reporting
Routing read-heavy or reporting workloads to replicas can protect the primary, but each replica has its own connection and resource budget. Read routing does not automatically make an expensive query harmless. Consider replication delay, consistency requirements, failover roles, and the possibility that an unavailable replica sends load back to the primary.
10. Timeouts, Queueing, and Backpressure
Pool acquisition timeout
The acquisition timeout limits how long a request waits for a connection. If it is too short, normal bursts create avoidable errors. If it is too long, requests accumulate, consume application resources, and may finish after users or upstream services have already abandoned them. Set it in relation to the end-to-end latency objective and make timeout failures observable as capacity signals.
Idle connection policy
Idle connections support fast reuse, but excessive idle capacity wastes the server budget and can mask multiplied pools. A minimum pool size may help workloads that must respond quickly after inactivity, while a lower idle limit may be better for large fleets. Tune idle behavior with cold-start latency, normal reuse, database connection cost, and failover recovery in mind.
Connection lifetime
Recycling connections can help remove stale sessions, adapt to infrastructure changes, and prevent abandoned connections from accumulating. Recycling too aggressively recreates the setup churn pooling is meant to avoid. Coordinate application lifetime settings with database, load balancer, proxy, and network timeouts so one layer does not repeatedly terminate connections that another expects to reuse.
Queue limits and load shedding
An unbounded queue converts a fast overload failure into slow memory growth and latency collapse. Define how many requests may wait, how long they may wait, which classes receive priority, and when the system should reject, defer, or degrade work. Background jobs can often remain in their job queue. User-facing requests may need a clear temporary failure. Expensive optional features may be disabled during saturation.
Retry behavior
Retries can multiply an overload. Use bounded attempts, exponential backoff, randomness, and retry only when the operation and failure mode make it safe. A pool timeout caused by sustained saturation should not trigger an immediate wave of identical attempts. Track original demand separately from retry demand so monitoring reveals amplification.
11. Compatibility and Session-State Risks
Aggressive multiplexing is safest when each transaction is self-contained. Transaction pooling can surprise applications that rely on a stable backend session across multiple transactions. Review the following before changing modes:
- Session-level settings that are expected to persist beyond one transaction.
- Temporary tables or cursors whose lifetime depends on a particular session.
- Advisory locks, notifications, or listener patterns tied to session identity.
- Prepared statement behavior in the driver, framework, pooler, and managed service.
- Migration tools, administrative consoles, and batch processes that expect direct semantics.
- Authentication and role-switching behavior that may affect pooling boundaries.
Cloud and pooler documentation should be checked for the exact version and configuration in use. For example, current Google Cloud documentation lists several PostgreSQL session features that are not supported in its transaction pooling mode, while PgBouncer documents how server connections are released and which parameters it can track. Compatibility testing should include normal requests, migrations, background jobs, failure recovery, and long-lived tasks.
12. Security Considerations
Protect the pooler as part of the database boundary
A pooler accepts credentials or identity assertions and opens paths to the database. Restrict network access, require encrypted transport where appropriate, keep certificates and software updated, limit administrative interfaces, and separate operational permissions from application roles. A pooler exposed more broadly than PostgreSQL can become the new attack surface.
Use least-privilege identities
Pooling does not justify sharing one highly privileged account across every service. Separate roles by service or workload where practical, grant only required database privileges, and protect credential rotation. Be aware that some poolers create separate pools per user/database pair, so identity design also affects connection multiplication and sizing.
Preserve audit meaning
When many clients share backend sessions, confirm what identity and client information remains visible in database logs and monitoring. Managed proxies may change how source addresses or sessions appear. Application-level request identifiers and structured audit context may be needed to correlate work without relying solely on backend process identity.
Prevent denial of service through admission controls
Client limits, queue limits, rate limits, authentication limits, and per-service budgets work together. A pooler with a very large client allowance and an unbounded queue can still be exhausted at the application or operating-system layer. Protect file descriptors, memory, CPU, and administrative capacity as well as PostgreSQL connection slots.
13. What to Monitor in Production
| Signal | What it reveals | Warning pattern |
|---|---|---|
| Pool utilization | How much configured capacity is in use | Sustained near-maximum use with growing waits. |
| Acquisition wait | Time requests spend outside PostgreSQL | Rising high-percentile wait before query time rises. |
| Active vs. idle sessions | Whether capacity is doing work or sitting unused | Many idle sessions across a large fleet, or too many active sessions. |
| Queued clients | Demand above current backend capacity | Long queues, long wait, or repeated queue timeouts. |
| Transaction duration | How long connections remain occupied | Long tail or transactions open during external calls. |
| Database saturation | CPU, memory, storage, locks, and cache pressure | Resource ceiling reached as concurrency increases. |
| Connection churn | How often sessions are created and destroyed | Spikes during deploys, autoscaling, or network events. |
| Error and retry rate | User impact and amplification | Timeouts followed by a larger retry wave. |
Monitor limits and demand together
A connection count without the configured limit lacks context. A configured limit without observed use lacks urgency. Dashboards should show actual, maximum, waiting, and rejected demand at the application pool, external pooler, and database. Annotate deployments, autoscaling changes, migrations, failovers, and configuration changes so shifts are explainable.
Alert on user impact and leading indicators
Connection failures are late indicators. Acquisition wait, queue depth, active-session growth, transaction duration, lock waits, and database saturation often rise first. Alerts should therefore combine leading indicators with user-facing latency and error objectives. Avoid alerting on a high connection count alone when the sessions are healthy and expected.
14. Troubleshooting Common Pool Problems
“Too many connections”
First identify which layer rejected the connection: the application pool, external pooler, proxy, operating system, or PostgreSQL. Compare configured maxima with actual peak and determine whether a deployment, scale event, job burst, leaked connection, or direct tool consumed the remaining budget. Do not immediately raise max_connections. Restore headroom, stop amplification, and determine why demand exceeded the plan.
Requests wait for a connection while the database looks idle
Possible causes include a pool that is genuinely too small, long connection hold time inside the application, a local pool isolated in one overloaded process, a pooler limit per user/database pair, failed or stale connections, or uneven traffic distribution. Compare wait time with checkout duration and active database work. If connections are checked out while no query runs, the application is holding them too broadly.
Increasing pool size made everything slower
This usually indicates that the old pool was limiting contention. More sessions entered PostgreSQL, increasing CPU scheduling, I/O competition, cache pressure, locks, or memory demand. Return to the previous safe size, locate the saturated resource or contention pattern, and optimize or scale before trying a higher concurrency level again.
Many idle connections
Check minimum pool sizes, process counts, replica counts, service proliferation, and whether every process eagerly opens its full pool. Reduce idle minimums where cold-start requirements allow, shorten excessive idle retention carefully, and consider a central pooler when the fleet needs many client processes but relatively few active database sessions.
Connection storms during deployments or incidents
Stagger startup, add randomized backoff, avoid synchronized health checks that all require new sessions, and keep pool warm-up gradual. Ensure retry policies do not reconnect at the same instant. For failover, test how quickly old connections are discarded and how the pooler handles clients while the replacement database becomes ready.
Transaction pooling breaks a feature
Identify which session assumption is involved. Move the operation to a compatible session-pooled or direct path, redesign it to keep state within the transaction, or use supported pooler features when available. Do not weaken the entire architecture without confirming the affected workload and alternatives.
15. Common Sizing Mistakes
- Setting every local pool equal to the PostgreSQL server limit.
- Using average connection count instead of maximum configured fleet demand.
- Ignoring rolling-deployment overlap and autoscaling ceilings.
- Giving web traffic, jobs, reporting, and migrations one undifferentiated pool.
- Raising max_connections before measuring CPU, storage, locks, and query latency.
- Treating a queue as failure and removing all backpressure.
- Allowing requests to wait longer than their end-to-end deadline.
- Adding a second pooler without understanding where each queue and timeout lives.
- Choosing transaction pooling without auditing session-state assumptions.
- Failing to reserve operational access for incidents and maintenance.
- Load testing with trivial queries or unrealistic data and then generalizing the result.
- Changing pool size, worker concurrency, query behavior, and infrastructure simultaneously.
16. A Safe Production Rollout Plan
Phase 1: Baseline
Document current limits, process counts, replica ceilings, pooling layers, timeouts, and operational reserves. Capture at least one representative peak and one deployment or batch window. Establish user-facing latency and error measures before changing anything.
Phase 2: Model
Create the connection budget and worst-case fleet calculation. Identify workloads that can queue, workloads that require isolation, and session features that constrain pooling mode. Choose a conservative range to test and define success and rollback criteria.
Phase 3: Test
Use production-like data volume and transaction mix. Test normal load, burst load, slow-query conditions, downstream failure, rolling deployment, reconnection, and failover if the system requires high availability. Change one major capacity variable at a time.
Phase 4: Progressive deployment
Apply the new behavior to a small traffic slice or service group. Watch pool wait, queue size, active sessions, database resource saturation, transaction duration, and errors. Expand only after the metrics remain within the agreed objectives.
Phase 5: Operationalize
Record ownership, review dates, alerts, dashboards, and the maximum replica assumptions behind the calculation. Add a connection-budget check to architecture reviews and deployment planning. Recalculate when services, worker counts, regions, database sizes, or workload patterns change.
17. PostgreSQL Connection Pool Review Checklist
- Every service, process type, replica, region, and job runner is included in the inventory.
- Maximum autoscaling and rolling-deployment overlap are included.
- The database connection limit and reserved slots are confirmed for the actual platform.
- Operational, monitoring, migration, and safety capacity are protected.
- Configured fleet demand is compared with the backend server-connection budget.
- Client limits and server limits are documented separately.
- Interactive, background, reporting, and operational workloads have appropriate isolation.
- Pooling mode is compatible with session state, prepared statements, locks, notifications, and migrations.
- Acquisition, query, transaction, idle, and lifetime timeouts are coordinated.
- Queues have bounded size or duration, and overload behavior is intentional.
- Retries use limits, backoff, and randomness and do not amplify saturation.
- Load tests reproduce realistic transactions, data volume, bursts, deploys, and failures.
- Dashboards show utilization, wait, queued clients, active and idle sessions, churn, saturation, and errors.
- Rollout and rollback procedures are documented and tested.
- The connection budget is reviewed whenever architecture or scaling limits change.
18. Frequently Asked Questions
What is a good PostgreSQL connection pool size?
There is no universal number. A good size is the smallest range that meets throughput and latency objectives under realistic peak load while keeping PostgreSQL below harmful resource and contention limits. It must also fit within a server-connection budget that preserves operational headroom.
Should pool size equal max_connections?
No. max_connections is the server admission ceiling. Application traffic should receive only part of that capacity because administration, monitoring, maintenance, platform functions, direct tools, and unexpected events need headroom. Multiple pools must share the application portion.
Can increasing max_connections improve performance?
It can remove an admission bottleneck when the server has unused capacity, but it can also increase memory allocation and allow more competing work. If CPU, storage, or locks are already saturated, more sessions often increase latency rather than throughput.
What is the difference between max client connections and pool size?
The client limit controls how many application sessions a pooler accepts. Pool size controls how many PostgreSQL server connections the pooler opens for a pool, often defined by a user/database pair. Many clients can therefore share fewer backend sessions.
When should I use PgBouncer?
PgBouncer is valuable when many processes, containers, or services connect to one PostgreSQL system and local pools cannot safely coordinate a shared backend budget. It is also useful when transaction pooling can multiplex many short transactions onto fewer server sessions.
Is transaction pooling always better than session pooling?
No. Transaction pooling usually provides stronger reuse, but it changes session semantics. Session pooling is safer for workloads that depend on persistent session state. Choose based on compatibility and measured scalability needs.
Why do I have many idle PostgreSQL connections?
Common reasons include minimum pool sizes, too many application processes, oversized per-process caps, long idle retention, or separate pools for many service and role combinations. Idle sessions are not automatically harmful, but they consume connection budget and may signal fleet multiplication.
How does serverless change pool sizing?
Serverless platforms can create many execution contexts quickly. Even tiny local pools can multiply into a large connection burst. A central proxy or pooler, bounded client demand, acquisition timeouts, and retry backoff are often more important than per-instance tuning alone.
What metrics show that a pool is too small?
Sustained acquisition wait or queueing while database CPU, storage, locks, and query latency remain healthy can indicate an overly restrictive pool. Confirm that connections are not held unnecessarily before increasing the size.
What metrics show that a pool is too large?
Low acquisition wait combined with high database saturation, worsening query latency, increasing lock waits, or throughput that no longer improves suggests excessive concurrency. Many permanently idle sessions can also indicate oversized pools.
Should background jobs share the web application pool?
They can in small systems, but separate budgets are safer when jobs are bursty, long-running, or resource intensive. Background work often tolerates queueing and should not consume all capacity needed for interactive requests.
How often should connection pool sizing be reviewed?
Review after meaningful changes to replica counts, worker models, services, regions, database resources, query mix, traffic patterns, pooling mode, or cloud platform. Also review after incidents involving connection exhaustion, timeouts, failover, or synchronized reconnects.
Conclusion
PostgreSQL connection pool sizing is a system-level capacity decision. The correct unit of analysis is not one application process and not the database limit alone. It is the full fleet: every service, worker, replica, pooling layer, background job, administrative tool, scaling event, and failure scenario competing for a finite server-connection budget.
Start by preserving operational headroom, calculate worst-case configured demand, and choose where the shared budget will be enforced. Then measure real connection hold time, pool wait, transaction duration, database saturation, and contention. Use load tests to find the concurrency range where throughput remains useful and latency remains controlled. Queue excess work deliberately, bound retries, and roll out gradually.
The best pool is not the one that keeps every request out of a queue. It is the one that keeps the whole system responsive, observable, and recoverable when demand is highest.
💬 Comments
No comments yet. Be the first to comment!
Login to comment.