Introduction
Modern software rarely fails in a simple, isolated way. A slow page may be caused by an overloaded database, a queue backlog, a remote API, a misconfigured cache, a saturated container, a network retry storm, or an unexpected interaction between several services. In distributed systems, the hardest part of troubleshooting is often not collecting more data. It is connecting the right data quickly enough to understand what actually happened.
OpenTelemetry addresses that problem by standardizing how applications and infrastructure generate, collect, process, and export telemetry. Instead of treating traces, metrics, and logs as separate projects tied to separate vendors, teams can use a common telemetry model and a vendor-neutral pipeline. That does not automatically create good observability, but it gives organizations a durable foundation on which good observability can be designed.
The timing is significant. OpenTelemetry became a CNCF graduated project in May 2026, reflecting production adoption, project maturity, security work, governance, and API stability. For engineering teams that postponed adoption because they considered the ecosystem too young, the risk calculation has changed. OpenTelemetry is increasingly a strategic architecture choice rather than an experimental integration.
This guide explains how to design an OpenTelemetry observability architecture without code. The focus is on decisions: which signals to collect, how to structure telemetry, where the Collector belongs, how to control cardinality and cost, how to preserve privacy, how to make telemetry reliable, and how to avoid replacing one form of vendor lock-in with a new form of operational complexity.
| Short answer: A strong OpenTelemetry architecture separates instrumentation from analysis. Applications emit standardized telemetry, Collectors receive and process it, and one or more backends store and visualize it. The architecture succeeds when telemetry is consistent, secure, cost-aware, reliable, and designed around real troubleshooting questions. |
Table of Contents
- 1. What OpenTelemetry Is—and What It Is Not
- 2. Why Observability Architecture Matters
- 3. Traces, Metrics, Logs, and Profiles
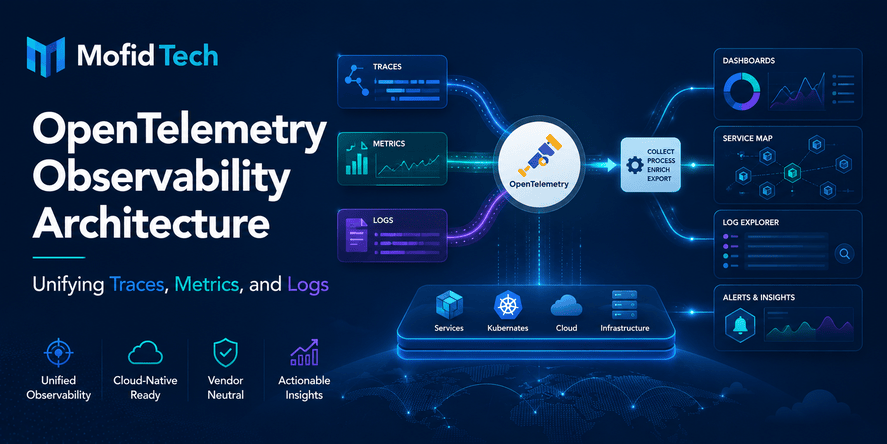
- 4. The OpenTelemetry Data Flow
- 5. Instrumentation Strategy
- 6. The OpenTelemetry Collector
- 7. Collector Deployment Patterns
- 8. Semantic Conventions and Telemetry Governance
- 9. Designing for Troubleshooting
- 10. Vendor Neutrality and Lock-In
- 11. Metric Cardinality and Cost
- 12. Trace Sampling Strategy
- 13. Security and Privacy
- 14. Reliability and Scaling
- 15. Performance Considerations
- 16. Migration Strategy
- 17. Real-World Use Cases
- 18. Comparison Framework
- 19. Common Mistakes
- 20. Troubleshooting OpenTelemetry Architectures
- 21. Production Readiness Checklist
- 22. OpenTelemetry for AI and Agentic Systems
- 23. Profiles and the Future of Unified Telemetry
- 24. FAQ
- 25. Conclusion
1. What OpenTelemetry Is—and What It Is Not
OpenTelemetry is an open-source observability framework and toolkit for generating, collecting, processing, and exporting telemetry data. Its most important architectural value is standardization. It gives developers and platform teams a common way to describe telemetry across languages, frameworks, services, and infrastructure so that downstream tools can consume the data consistently.
OpenTelemetry is not a monitoring dashboard, a long-term telemetry database, an incident-management platform, or an observability vendor. It deliberately stops before the analysis and visualization layer. That separation is crucial: an application can emit OpenTelemetry data and later send that data to different open-source or commercial backends without redesigning every instrumentation point.
This means OpenTelemetry should be treated as an observability data layer. It sits between the systems that produce operational evidence and the systems that analyze that evidence. In a mature architecture, developers do not need to care which backend stores a trace when they instrument an important operation. They care that the operation is described consistently and that its context can move across service boundaries.
1.1 Observability is more than monitoring
Monitoring typically asks known questions such as whether CPU usage is high, whether an endpoint is available, or whether an error rate crossed a threshold. Observability is broader: it aims to let teams investigate unexpected behavior using the telemetry already emitted by the system. A well-instrumented application should support questions that were not predicted when the dashboard was created.
That distinction matters because collecting more metrics does not guarantee observability. A system can have hundreds of dashboards and still be difficult to debug if request context is missing, service names are inconsistent, logs cannot be linked to traces, or high-cardinality dimensions are discarded. OpenTelemetry provides common primitives, but the architecture must make those primitives useful.
1.2 The architectural promise
- Standardize telemetry generation across teams and programming languages.
- Correlate traces, metrics, and logs through shared context.
- Route telemetry through a neutral processing layer before it reaches a backend.
- Reduce the cost of changing observability vendors or using multiple backends.
- Apply organization-wide controls for filtering, enrichment, sampling, security, and data quality.
- Create a foundation that can extend to new signals such as continuous profiles and new workload types such as AI agents.
2. Why Observability Architecture Matters in 2026
OpenTelemetry’s 2026 graduation matters because production observability is infrastructure, not a temporary developer convenience. Once telemetry is embedded across hundreds of services, changing it becomes expensive. Teams therefore need confidence that the standard they adopt will remain stable, governable, and broadly supported. CNCF graduation does not guarantee that every component is equally mature, but it is a strong signal that the project as a whole has reached a level of maturity appropriate for widespread production use.
At the same time, software architectures are becoming more heterogeneous. A single user transaction can cross a browser, an API gateway, multiple services, a cache, a database, a message broker, a managed cloud service, and an AI model endpoint. Each layer may come from a different vendor. A telemetry architecture that only understands one runtime or one cloud creates blind spots precisely where distributed failures occur.
The second pressure is economics. Telemetry can grow faster than application traffic because each request can produce multiple spans, log records, metrics, events, and infrastructure measurements. Observability cost therefore becomes an architecture concern. Sampling, filtering, cardinality control, retention, and routing need to be designed intentionally rather than added after the first large bill.
The third pressure is governance. Telemetry may contain identifiers, URLs, database statements, user information, network details, error messages, or business attributes. Without a consistent processing layer, every team may apply privacy controls differently. OpenTelemetry creates a place to standardize those controls, but only if the organization treats telemetry as governed data.
3. The Four Telemetry Signals: Traces, Metrics, Logs, and Profiles
3.1 Traces explain the path of work
A distributed trace represents the path of a request or operation through a system. The trace is composed of spans, where each span describes a meaningful unit of work such as receiving an API request, calling another service, querying a database, publishing a message, or invoking a model. The main value of tracing is causality: engineers can see which operations happened, how long they took, and how they were related.
Tracing is especially valuable when average metrics look healthy but individual requests are slow or failing. A latency metric can tell you that the ninety-ninth percentile became worse. A trace can show which dependency or branch in the request path accounted for the delay.
3.2 Metrics summarize behavior over time
Metrics are aggregated measurements captured over time. They are ideal for alerting, trend analysis, capacity planning, service-level objectives, and high-level health assessment. Request rates, error ratios, queue depth, CPU utilization, memory use, and latency distributions are common metric categories.
Metrics are efficient because they summarize many events into time-series data, but that efficiency depends on controlled dimensionality. If every unique user, request, URL, or identifier becomes a metric attribute, the number of time series can explode. Metric design therefore requires stronger cardinality discipline than trace or log design.
3.3 Logs preserve detailed event records
Logs capture events and messages that are useful for diagnosis, auditing, operational explanation, and application behavior. OpenTelemetry does not require organizations to abandon existing logging libraries. Its log model is designed to integrate legacy and modern logging while improving correlation with traces and resource context.
The key architectural improvement is correlation. A log entry that carries trace context can be linked directly to the distributed request that produced it. This is much more reliable than manually matching timestamps or searching for an identifier that may be formatted differently across services.
3.4 Profiles add code-level resource context
Continuous profiling records where applications spend CPU time, allocate memory, or consume other resources at code level. In March 2026, OpenTelemetry Profiles entered public alpha, showing the project’s direction toward a more unified observability model. Profiles should not yet be treated as equally mature across every environment, but they are strategically important because they can connect high-level symptoms to low-level resource consumption.
For example, a trace may show that one service dominates request latency, while a profile can help explain which execution path inside that service consumes the most CPU. This creates a natural progression from symptom to service to code-level cause.
| Signal | Best question it answers | Strength | Main risk |
|---|---|---|---|
| Traces | Where did this request spend time or fail? | Causal path across services | Volume and sampling complexity |
| Metrics | Is the system healthy over time? | Efficient aggregation and alerting | High-cardinality dimensions |
| Logs | What detailed event occurred? | Rich diagnostic context | Noise, volume, and sensitive data |
| Profiles | Where are resources consumed inside code? | Code-level performance evidence | Maturity, storage, and interpretation complexity |
4. How OpenTelemetry Data Flows Through an Architecture
A useful mental model is producer, transport, processing, and analysis. Applications and infrastructure produce telemetry. OpenTelemetry SDKs, agents, or other instrumentation components encode that telemetry using common models. Telemetry is transported—often through the OpenTelemetry Protocol—to a Collector. The Collector receives, enriches, filters, samples, transforms, batches, and exports the data. Finally, one or more observability backends store, query, visualize, and alert on it.
The architecture is intentionally modular. Applications should not need to know whether traces ultimately go to an open-source backend, a commercial platform, a security analytics system, or two destinations at once. That routing decision belongs in the telemetry pipeline, not in business logic.
| Architecture principle: Keep telemetry generation close to the application, but keep telemetry policy outside the application whenever possible. Developers should describe meaningful operations; platform-level components should enforce routing, filtering, enrichment, sampling, and export policy. |
4.1 Resource context identifies where telemetry came from
Telemetry is only useful when teams know which service, version, environment, host, container, namespace, or region produced it. Resource attributes provide this identity. Consistent resource naming is one of the highest-leverage observability practices because it lets logs, traces, and metrics describe the same operational entity using the same vocabulary.
A common failure pattern is to allow every team to invent service names independently. One service may be called checkout-api in traces, checkout in logs, and payment-backend in metrics. Correlation becomes fragile. A telemetry architecture should define service identity as part of platform governance, not as an incidental configuration detail.
4.2 Context propagation connects distributed work
Distributed tracing depends on context propagation. When one service calls another, trace context must travel with the request so that downstream spans belong to the same trace. If propagation breaks at an API gateway, queue, proxy, or asynchronous boundary, the trace becomes fragmented and the most useful causal link disappears.
Teams should therefore test propagation as an architectural capability. The question is not only whether an individual service creates spans, but whether user journeys remain connected across network calls, messaging systems, scheduled jobs, and asynchronous workflows.
5. Choosing an Instrumentation Strategy
Instrumentation determines what the system can explain later. The goal is not maximum telemetry. The goal is sufficient, consistent telemetry around important operations and dependencies. A good strategy combines automatic instrumentation for broad baseline coverage with deliberate manual instrumentation for business-critical workflows that generic libraries cannot understand.
5.1 Automatic instrumentation
Automatic instrumentation can capture common framework and library operations with relatively little application change. It is useful for HTTP requests, database clients, messaging libraries, runtime behavior, and common infrastructure interactions. Its main advantage is speed and consistency: teams can gain broad visibility without manually instrumenting every service.
The limitation is semantic depth. Automatic instrumentation knows that a database call happened, but it may not know that the call was part of a checkout authorization or a university enrollment workflow. It should be treated as baseline coverage rather than the final observability design.
5.2 Manual instrumentation
Manual instrumentation adds domain meaning. Teams can create spans or events around meaningful business operations, attach bounded attributes that help diagnosis, and define metrics that represent service outcomes rather than only infrastructure behavior. This is where observability becomes specific to the product.
Manual instrumentation should be selective. Instrumenting every function creates noise, increases cost, and makes traces harder to read. The best manual spans usually represent durable architectural or business boundaries: external calls, queue processing, workflow phases, expensive computations, critical validations, or domain operations that users and support teams care about.
5.3 Library instrumentation
Shared libraries can embed consistent telemetry around capabilities used by many applications. This is valuable for internal HTTP clients, database abstractions, authentication components, messaging libraries, or AI gateways. The advantage is organizational consistency. The risk is hidden coupling: if a shared library emits unstable or high-cardinality attributes, the problem can affect every service that uses it.
Platform teams should therefore treat instrumentation libraries as production interfaces. Changes to names, attributes, or metric dimensions can break dashboards and alerts just as API changes can break application consumers.
| Approach | Best use | Advantages | Risks |
|---|---|---|---|
| Automatic | Baseline framework and dependency coverage | Fast adoption, broad consistency | May lack business context; can create noisy data |
| Manual | Critical workflows and domain operations | High diagnostic value and meaningful context | Requires engineering discipline and review |
| Library | Repeated internal capabilities | Organization-wide consistency | Changes can propagate widely and create hidden coupling |
6. The OpenTelemetry Collector as the Policy Layer
The OpenTelemetry Collector is a vendor-agnostic service that receives, processes, and exports telemetry. Its architecture is built around pipelines. Receivers accept data, processors modify or control it, and exporters send it to destinations. Connectors can bridge pipelines, while extensions provide supporting capabilities such as health or authentication functions.
For architecture teams, the Collector is important because it centralizes telemetry policy. Instead of requiring every application team to implement sampling, redaction, routing, batching, enrichment, and export logic independently, those responsibilities can be managed in a common layer.
This does not mean every policy should be centralized. Some decisions must happen close to the application, especially when data should never leave the process in raw form. The right boundary depends on the sensitivity of the data, network topology, performance constraints, and organizational ownership.
6.1 Receivers
Receivers accept telemetry from applications, agents, infrastructure components, or other Collectors. A production design should expose only the receivers that are necessary. Every network-facing component expands operational and security surface area, so minimalism is a security and maintainability advantage.
6.2 Processors
Processors transform, filter, enrich, batch, sample, or otherwise control telemetry as it moves through a pipeline. This is where organizations can remove sensitive attributes, normalize metadata, reduce noise, attach infrastructure context, or protect downstream systems from unnecessary volume.
Processor order matters because one transformation can affect the behavior of another. For example, removing an attribute before a sampling decision may change which traces qualify for retention. Even in a no-code architecture plan, teams should document processing order as part of the observability contract.
6.3 Exporters
Exporters send telemetry to one or more destinations. This capability supports vendor neutrality, dual-running during migrations, and specialized routing. For example, the same normalized telemetry could be sent to a primary observability backend and a second destination for security analytics or long-term storage, provided cost and privacy requirements justify the duplication.
7. Collector Deployment Patterns: Agent, Gateway, and Hybrid
7.1 Agent pattern
In the agent pattern, a Collector runs close to the workload, such as on the same host, node, or execution environment. Local collection reduces application complexity and can enrich telemetry with local resource information. It also limits the distance that raw telemetry travels before processing.
The main trade-off is operational scale. A large fleet may require managing many Collector instances. Resource limits, upgrades, configuration drift, and health monitoring become important. Agent deployments are therefore most effective when managed through a strong platform or orchestration layer.
7.2 Gateway pattern
In the gateway pattern, applications send telemetry to a shared Collector tier. This centralizes processing, routing, security policy, and backend connectivity. It is especially useful for tail sampling, multi-backend routing, and organization-wide transformations that need a broader view of telemetry.
The risk is concentration. A gateway tier can become a bottleneck or a single point of failure if it is not scaled, load-balanced, and monitored. Network distance can also increase, and sensitive raw telemetry may travel farther before redaction.
7.3 Hybrid pattern
A hybrid pattern uses local Collectors for immediate enrichment, filtering, and resilience, then forwards selected telemetry to a gateway tier for centralized sampling, routing, or organization-wide policy. This is common in larger environments because it separates local concerns from global concerns.
Hybrid designs are powerful but easier to overcomplicate. Every additional hop adds operational state, buffering, failure modes, and cost. Teams should add tiers only when they solve a specific problem that cannot be handled cleanly in a simpler architecture.
| Pattern | Best for | Strength | Main concern |
|---|---|---|---|
| Agent | Local enrichment and low-latency collection | Close to workload; resilient local processing | Fleet management overhead |
| Gateway | Central policy and routing | Simple backend integration; global controls | Shared bottleneck and failure domain |
| Hybrid | Large or regulated environments | Balances local and central controls | More moving parts and operational complexity |
8. Semantic Conventions and Telemetry Governance
Semantic conventions define common names and meanings for telemetry attributes, metrics, spans, events, and resources. They are one of OpenTelemetry’s most important features because observability becomes much more powerful when different languages and services describe the same concept consistently.
Without shared conventions, every team creates its own vocabulary. One service records an HTTP status as status, another as http_status, another as response_code. Queries become complicated, dashboards become service-specific, and incident responders waste time translating data models instead of diagnosing problems.
OpenTelemetry semantic conventions reduce this fragmentation. They cover areas such as HTTP, databases, messaging, cloud providers, CI/CD, and other domains. Organizations should adopt standard conventions first and create internal extensions only when a domain concept is genuinely not represented.
8.1 Treat telemetry schemas like APIs
Telemetry fields are consumed by dashboards, alerts, service-level objectives, automation, incident workflows, security tools, and data pipelines. Renaming an attribute can therefore break downstream consumers even though the application itself continues to function. Mature teams manage telemetry schema changes with the same care they apply to public APIs.
Define ownership, review significant changes, avoid unbounded dimensions, and document internal conventions. When a new attribute is proposed, ask who will query it, whether it has bounded cardinality, whether it may contain sensitive data, and whether the same concept already exists in a standard convention.
8.2 Build a telemetry dictionary
A telemetry dictionary is a practical governance artifact that lists approved service identifiers, business attributes, metric dimensions, sensitive fields, ownership, and expected retention. It does not need to be bureaucratic. Its purpose is to keep teams from inventing incompatible names and to make observability data understandable beyond the team that created it.
9. Design Telemetry Around Troubleshooting Questions
The most important observability design question is not “What can we collect?” but “What decisions must this telemetry support?” Start with failure scenarios and operational questions. If checkout latency increases, what evidence will identify whether the delay is in the frontend, gateway, service, database, payment provider, or queue? If one tenant experiences failures while others do not, which safe attribute distinguishes the affected traffic? If an AI request becomes expensive, can the team link model latency and usage to the originating application operation?
Designing from questions prevents telemetry accumulation for its own sake. Every high-volume field should justify its operational value. Every metric should support an alert, SLO, capacity question, or product decision. Every manual span should represent a meaningful boundary. Every log should add information that cannot be obtained more efficiently from another signal.
9.1 Use a symptom-to-cause workflow
A common workflow begins with a metric alert, moves to traces for request-level causality, then uses logs or profiles for deeper explanation. The architecture should make that transition easy. If the metric says a service is failing but the trace backend uses a different service identity, responders lose time. If trace identifiers are missing from logs, responders must search manually. If profiles cannot be associated with the affected service version, code-level analysis becomes guesswork.
The goal is not to merge every signal into one database. The goal is to preserve enough shared context that an engineer can move between signals without losing the investigative thread.
9.2 Observe user journeys, not only services
Service dashboards are necessary, but users experience journeys. A registration flow, payment flow, report generation task, file upload, password reset, or AI-assisted workflow may cross several components. Distributed tracing is most valuable when it reflects these end-to-end journeys.
For critical journeys, define expected stages, important dependencies, service-level objectives, and business outcomes. Then verify that telemetry can explain where and why the journey deviates from the expected path.
10. Vendor Neutrality Without Creating New Lock-In
OpenTelemetry reduces instrumentation lock-in, but it does not eliminate every form of dependency. A team can still become operationally dependent on a vendor-specific query language, proprietary dashboards, alert semantics, tail-sampling logic, or backend-only enrichment. The goal should therefore be portability at the boundaries that matter most, not an unrealistic promise of zero dependency.
The strongest portability boundary is the application. Business code should emit standard telemetry without hard-coding assumptions about a specific backend whenever possible. Collector pipelines should use standard protocols and broadly supported components. Vendor-specific processing can still be used where it creates clear value, but it should be documented as an intentional trade-off.
10.1 Separate portable telemetry from backend-specific analysis
Portable telemetry describes the system: services, operations, dependencies, outcomes, latency, errors, resources, and meaningful business dimensions. Backend-specific analysis describes how a particular platform stores, queries, visualizes, or alerts on that telemetry. Keeping those concerns distinct makes migrations less disruptive.
A practical test is to ask: if the organization changed observability backends next year, would application teams need to rewrite instrumentation, or would platform teams mainly update export and analysis layers? The closer the answer is to the second option, the stronger the architecture.
11. Metric Cardinality and Observability Cost
Metric cardinality is the number of unique attribute combinations associated with a metric. It is one of the most important observability cost and correctness concepts because every unique combination can become a separate time series or data point that the system must maintain, transmit, store, and query.
High cardinality can grow unexpectedly. Adding a user identifier, session identifier, raw URL, request identifier, or unbounded error message to a metric can multiply the number of unique combinations dramatically. The problem is not merely cost. When SDK cardinality limits are reached, overflow behavior can preserve totals while making attribute-level breakdowns incomplete, which can affect dashboards and service-level objectives.
In August 2026, OpenTelemetry published practical guidance on metric cardinality limits, reinforcing the need to treat cardinality as an operational design concern rather than a backend-only problem.
11.1 What belongs in metrics
- Bounded route templates rather than raw URLs.
- Status classes or well-defined outcome categories rather than free-form messages.
- Environment, region, service, and version identifiers with controlled value sets.
- Business dimensions only when the number of possible values is understood and operationally necessary.
- Dimensions that support an actual alert, SLO, capacity decision, or diagnostic question.
11.2 What usually does not belong in metrics
- Request IDs, trace IDs, session IDs, or other effectively unique identifiers.
- Raw user input or arbitrary strings.
- Full URLs with query parameters.
- Unbounded exception or error messages.
- High-volume identifiers added “just in case” without a clear query use case.
11.3 Create a telemetry budget
A telemetry budget is an engineering constraint that defines expected data volume, retention, cardinality, and cost by signal. It helps teams discuss observability in economic terms before scale creates a crisis. The budget can distinguish high-value production traces from routine traces, high-resolution operational metrics from low-value dimensions, and diagnostic logs from verbose development logging.
The goal is not to minimize telemetry at all costs. Under-instrumented systems also create cost through longer incidents, slower development, and poor capacity decisions. The goal is to spend telemetry volume where it improves reliability and decision-making.
12. Trace Sampling Strategy
Tracing every request can be unnecessary or too expensive at high volume. Sampling controls how much trace data is retained while trying to preserve the traces that are most useful. OpenTelemetry distinguishes head sampling and tail sampling, and each has different architectural implications.
12.1 Head sampling
Head sampling decides early, before the full trace is known. It is efficient and relatively simple because the system does not need to wait for every span. The trade-off is limited information: an early decision cannot know that a downstream operation will eventually fail or become unusually slow.
Head sampling works well for high-volume services when a representative sample is sufficient and operational simplicity matters. It can also protect the telemetry pipeline from overload before more expensive processing occurs.
12.2 Tail sampling
Tail sampling makes a decision after observing most or all of a trace. This enables policies such as retaining traces with errors, unusually high latency, specific business outcomes, or traffic from a new deployment. It produces a more diagnostically valuable sample but requires state, memory, coordination, and careful scaling.
Tail sampling should be treated as a distributed-system component in its own right. If the sampling tier is overloaded, decisions may be delayed, traces may be incomplete, or the pipeline may fall back to less sophisticated behavior. The sampling system itself therefore needs health monitoring and capacity planning.
12.3 Sampling principles
- Preserve errors and rare failures whenever practical.
- Preserve unusually slow traces that reveal tail-latency problems.
- Increase retention for new deployments or risky changes during rollout windows.
- Avoid sampling rules that systematically hide low-volume services or uncommon user journeys.
- Revisit sampling as traffic patterns, architecture, and incident experience change.
- Measure the sampling pipeline itself so teams know whether intended policies are actually being applied.
13. Security and Privacy in OpenTelemetry Architectures
Telemetry is operational data, but it can still contain sensitive information. Error messages may include personal data. URLs can reveal identifiers. Database or application attributes can expose business records. Network metadata can reveal infrastructure topology. A secure observability architecture assumes that sensitive data may be captured accidentally and creates controls to minimize, detect, and protect it.
OpenTelemetry’s security guidance emphasizes securing Collector infrastructure and configuration, protecting sensitive telemetry, preventing tampering, supporting privacy requirements, and defending against denial-of-service risks. Security should therefore be designed across the entire telemetry path: producer, network, Collector, backend, and human access.
13.1 Data minimization comes first
The safest sensitive field is the field that is never collected. Before adding an attribute, ask whether the operational value justifies the privacy and retention risk. Avoid recording raw secrets, authentication tokens, credentials, full request bodies, unnecessary personal information, or unbounded user input.
Redaction in the Collector is useful, but it should not become an excuse to emit highly sensitive data from applications unnecessarily. Some data should be removed or transformed as close to the source as possible, especially when crossing trust boundaries.
13.2 Protect data in transit and at rest
Telemetry should be transmitted through authenticated, encrypted channels when crossing networks or trust boundaries. Collector endpoints should not be exposed more broadly than necessary. Backends and storage systems should apply access controls, retention policies, encryption, and auditability appropriate to the sensitivity of the data.
Collector configurations may themselves contain sensitive authentication material or certificates. They should be stored and managed through secure configuration and secret-management practices rather than treated as ordinary text files.
13.3 Apply least privilege
Collectors should run with only the permissions required to receive, process, enrich, and export telemetry. Components that are not required should be removed or disabled to reduce attack surface. Network access should be limited so that a compromised Collector cannot become an unnecessary bridge to unrelated systems.
13.4 Separate observability logs from audit logs
Operational logs help engineers understand behavior. Audit logs provide evidence about security-relevant actions, identity, authorization, administrative changes, and accountability. They can overlap, but they have different integrity, retention, access, and compliance requirements. A telemetry platform should not assume that ordinary observability logs automatically satisfy audit requirements.
14. Reliability and Scaling of the Telemetry Pipeline
Observability infrastructure becomes most valuable during incidents, exactly when application traffic and error volume may spike. If the telemetry pipeline collapses under the same pressure as the application, engineers lose evidence when they need it most. Reliability must therefore be designed into the telemetry path rather than assumed.
The first principle is backpressure awareness. Receivers, processors, queues, exporters, and backends each have finite capacity. If a downstream backend slows down, the Collector needs a deliberate behavior: buffer within safe limits, retry, shed lower-value data, or route elsewhere. Unlimited buffering simply moves the failure into memory or disk exhaustion.
14.1 Monitor the Collector as production infrastructure
Collectors should expose their own health and internal telemetry. Teams should watch queue utilization, dropped data, export failures, processing latency, memory pressure, CPU use, receiver load, and retry behavior. A dashboard that only monitors applications but ignores the telemetry pipeline creates a dangerous blind spot.
14.2 Design failure domains
A shared gateway can simplify operations, but it also creates a larger failure domain. Separate environments, regions, or high-value workloads when necessary. Avoid a design where one misbehaving tenant or high-volume service can exhaust shared telemetry capacity for every other service.
At large scale, consider workload isolation, capacity limits, controlled fan-out, and clear ownership between application teams and the observability platform team. Reliability is not only a technical configuration; it is also an organizational operating model.
14.3 Plan for backend outages
Observability backends can become unavailable. Decide what the pipeline should do before that happens. How long can telemetry be buffered? Which signal has priority? Is it acceptable to drop routine traces while preserving error traces? Can metrics continue to flow to a secondary system? How will operators know that data is being lost? These policies should be explicit and tested.
15. Performance Considerations
Instrumentation adds work. Spans must be created, attributes recorded, context propagated, log records enriched, and telemetry exported. The overhead is often acceptable when instrumentation is well designed, but careless telemetry can increase latency, CPU use, memory pressure, and network traffic.
Performance design begins with restraint. Avoid attaching large payloads to spans, generating spans for trivial internal functions, emitting excessively verbose logs in production, or using expensive attributes that require significant computation. Prefer bounded, operationally meaningful metadata.
Batching and asynchronous export can reduce per-request overhead, but they introduce buffering and failure semantics. The architecture should define how much telemetry can be queued and what happens when the process terminates or the exporter becomes unavailable.
15.1 Measure instrumentation overhead
Do not assume the telemetry layer is free. Benchmark representative workloads before and after major instrumentation changes. Watch application latency, memory, CPU, network traffic, and garbage collection or runtime behavior where relevant. Large changes in telemetry volume should trigger the same performance review as large changes in application logic.
16. A Practical Migration Strategy to OpenTelemetry
Most organizations do not start from zero. They already have vendor agents, application logging, dashboards, infrastructure metrics, custom instrumentation, or legacy tracing libraries. A successful migration therefore focuses on risk reduction and coexistence rather than a single big-bang replacement.
16.1 Step 1: inventory the current observability estate
Document which services emit traces, metrics, and logs; which agents are deployed; which dashboards and alerts are business-critical; which teams own instrumentation; and where vendor-specific assumptions exist. Include data volume and cost where available. The inventory reveals migration dependencies that are easy to miss if the project begins with tooling alone.
16.2 Step 2: define the target telemetry contract
Agree on service identity, environment naming, required resource attributes, semantic conventions, sensitive-data policy, sampling principles, and ownership. The target contract should be small enough to adopt but strong enough to prevent each team from creating a different OpenTelemetry dialect.
16.3 Step 3: choose a representative pilot
Select a service or user journey that has meaningful dependencies but is not the most critical system in the organization. The pilot should exercise HTTP calls, a database, logs, and at least one asynchronous or external dependency if possible. The goal is to learn architecture and operations, not merely prove that spans can be generated.
16.4 Step 4: run old and new paths in parallel
During transition, keep critical existing dashboards and alerts available while validating OpenTelemetry data quality. Compare request counts, error rates, latency distributions, trace completeness, and log correlation. Differences should be explained before the old path is removed.
16.5 Step 5: migrate by capability, not by enthusiasm
Move workloads when the new telemetry path is reliable enough to support their operational needs. Some services may migrate quickly through automatic instrumentation. Others may require manual work to preserve critical business context. Prioritize operational value over uniform timelines.
16.6 Step 6: decommission vendor-specific instrumentation deliberately
Once equivalent or better coverage is verified, remove duplicate agents and redundant telemetry to avoid double cost and confusing data. Update runbooks, ownership, dashboards, and incident procedures so the migration is operationally complete rather than technically complete only.
17. Real-World Use Cases
17.1 Microservices troubleshooting
A user reports that checkout occasionally takes ten seconds. Service-level metrics show a latency increase but not the cause. A distributed trace reveals that only requests involving one payment provider are slow. Logs correlated to those trace IDs show repeated remote retries. Infrastructure metrics confirm that internal services are healthy. The incident can be narrowed quickly because the signals share context.
17.2 Database performance diagnosis
An application experiences rising latency after a release. Traces show that database spans account for most of the additional time. Metrics indicate that the database is not globally saturated, suggesting the problem may be query-specific or workload-specific. The team can then focus database analysis on the operations associated with the slow traces instead of treating the entire database as unhealthy.
17.3 Queue and asynchronous workflow visibility
Asynchronous systems are difficult to debug when trace context ends at the message publisher. With consistent propagation, teams can connect the request that created a message to the worker that processed it. Queue metrics show backlog, traces show processing delay and dependencies, and logs explain exceptional outcomes. The user journey remains visible even though execution is separated in time.
17.4 Multi-cloud or hybrid architectures
A company may run services in more than one cloud, plus on-premises systems. Vendor-specific telemetry can fragment visibility along infrastructure boundaries. OpenTelemetry provides a common data layer across those environments so the organization can normalize service identity and route telemetry to one or more analysis systems.
17.5 Platform engineering
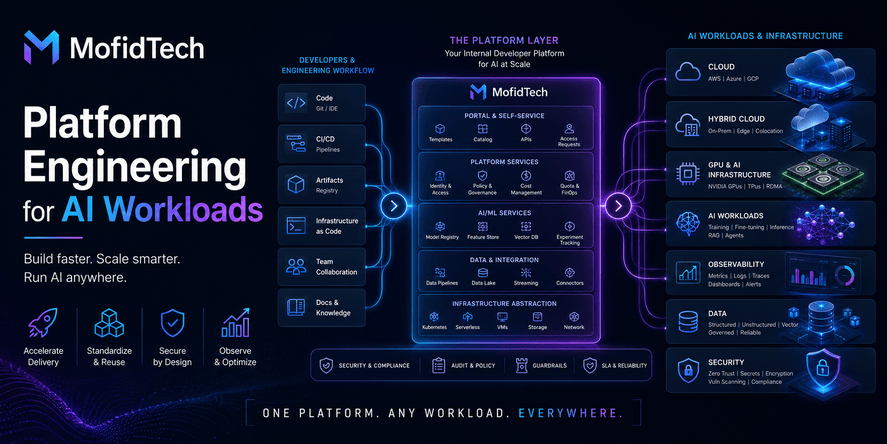
A platform team can provide standardized instrumentation defaults, Collector deployment, semantic conventions, sensitive-data controls, and approved dashboards as a paved road. Application teams gain observability without becoming experts in every backend. The platform team gains consistent data that is easier to govern and support.
18. Comparison: Traditional Vendor-Specific Instrumentation vs OpenTelemetry
| Dimension | Vendor-specific approach | OpenTelemetry-centered approach |
|---|---|---|
| Application instrumentation | Often tied to one vendor SDK or agent | Standardized instrumentation with backend-independent intent |
| Backend changes | May require application or agent changes | Often concentrated in Collector/export and analysis layers |
| Signal correlation | Strong inside one vendor if configured well | Designed around shared context across standard signals |
| Multi-backend routing | May be difficult or costly | Natural architectural capability through exporters |
| Governance | Often defined by vendor data model | Can be standardized by the organization using semantic conventions |
| Operational complexity | Lower when one vendor manages most components | Can be higher if the organization self-manages Collectors and policy |
| Portability | Depends on vendor capabilities | Higher at instrumentation and protocol boundaries |
| Customization | Often optimized for the vendor ecosystem | Broad but requires architectural discipline |
18.1 When a vendor-specific approach can still be reasonable
A fully managed vendor approach can be appropriate for small teams that value operational simplicity more than portability, especially when the vendor provides excellent automatic instrumentation and the organization has no realistic need for multiple backends. OpenTelemetry should not be adopted merely because it is fashionable.
The stronger case for OpenTelemetry appears when an organization has multiple languages, multiple infrastructure environments, long-lived services, platform engineering needs, significant observability cost, or a desire to separate application instrumentation from backend choice.
19. Common OpenTelemetry Architecture Mistakes
19.1 Collecting everything because storage is someone else’s problem
Uncontrolled telemetry becomes expensive, noisy, and difficult to query. Teams should collect data according to operational value, not maximum technical possibility.
19.2 Treating automatic instrumentation as complete observability
Automatic instrumentation provides coverage but may miss the business operations and outcomes that matter during incidents.
19.3 Ignoring service identity consistency
If traces, metrics, and logs name the same service differently, correlation breaks and dashboards become unreliable.
19.4 Adding high-cardinality values to metrics
Unique identifiers and raw user-controlled values can create series explosions, cost growth, and overflow behavior that makes filtered queries incomplete.
19.5 Centralizing too much too early
A complex multi-tier Collector architecture can become harder to operate than the observability problem it was intended to solve. Start simple and add tiers only for concrete needs.
19.6 Forgetting the telemetry pipeline during monitoring
Collectors, queues, and exporters can fail. If the observability platform does not monitor itself, teams may trust dashboards that are missing data.
19.7 Relying on redaction as the only privacy control
Sensitive data should be minimized at source whenever possible. Central redaction is a defense layer, not permission to emit secrets or unnecessary personal information.
19.8 Assuming OpenTelemetry eliminates vendor lock-in completely
Instrumentation becomes more portable, but dashboards, queries, alerting, sampling, and backend data models can still create dependency. Document those trade-offs.
19.9 Migrating without validating critical alerts
A migration that produces beautiful traces but breaks production alerts is not complete. Compare old and new telemetry before decommissioning existing paths.
19.10 Using telemetry without ownership
Every important metric, dashboard, alert, and custom attribute should have an owner. Unowned telemetry becomes stale and unreliable over time.
20. Troubleshooting an OpenTelemetry Architecture
When OpenTelemetry appears to be “missing data,” the fastest approach is to troubleshoot the pipeline stage by stage rather than staring at the final dashboard. Confirm whether the application produced telemetry, whether context was propagated, whether the Collector received it, whether processors changed or dropped it, whether the exporter succeeded, and whether the backend indexed it as expected.
20.1 Missing traces
- Check whether the relevant operation is instrumented at all.
- Verify trace context across service boundaries, proxies, gateways, queues, and background jobs.
- Review head or tail sampling policies to confirm the trace was not intentionally excluded.
- Confirm the Collector is receiving and exporting trace data without drops or errors.
- Check whether service identity or environment filters in the backend are hiding the trace.
20.2 Logs cannot be linked to traces
- Verify that logging integration records trace and span context when available.
- Check whether logs and traces use consistent resource identity.
- Confirm that intermediate processing does not remove correlation fields.
- Ensure the backend understands and indexes the correlation fields used by the telemetry pipeline.
20.3 Metrics disagree with expectations
- Check metric definition, aggregation, temporality, and units.
- Inspect whether cardinality limits or filtering removed attribute-level detail.
- Confirm resource and measurement attributes are modeled correctly.
- Compare the metric against an independent source such as request counts or trace-derived evidence before changing alerts.
20.4 Collector memory or CPU grows unexpectedly
- Look for traffic spikes, excessive telemetry volume, or high-cardinality enrichment.
- Review tail-sampling state, queues, batching behavior, and exporter backpressure.
- Check whether a downstream backend is slow and causing buffers or retries to grow.
- Confirm memory and queue limits are deliberate rather than effectively unlimited.
20.5 Backend costs rise rapidly
- Measure volume separately for traces, metrics, and logs.
- Identify high-cardinality metrics and verbose logging sources.
- Review sampling and retention against actual troubleshooting value.
- Remove duplicate exports created during migrations once validation is complete.
- Route high-value and low-value telemetry differently when the backend and policy allow it.
21. Production Readiness Checklist
- ☐ Every production service has a stable, consistent service identity.
- ☐ Environment, version, region, and other core resource attributes are standardized.
- ☐ Trace context survives important synchronous and asynchronous boundaries.
- ☐ Automatic instrumentation provides baseline coverage, and critical business workflows have deliberate manual telemetry.
- ☐ Metric dimensions are reviewed for bounded cardinality.
- ☐ Telemetry volume and cost are measured by signal and major service.
- ☐ Trace sampling policies preserve errors, unusual latency, and other high-value traces.
- ☐ Collectors have defined CPU, memory, queue, and scaling expectations.
- ☐ Collector health and dropped-data indicators are monitored.
- ☐ Backend outage behavior is documented and tested.
- ☐ Sensitive data is minimized at source and filtered or transformed where necessary.
- ☐ Telemetry is encrypted and authenticated across relevant network boundaries.
- ☐ Collector and backend access follows least privilege.
- ☐ Only required Collector components and endpoints are enabled.
- ☐ Telemetry schema changes have ownership and review.
- ☐ Critical dashboards and alerts are validated against the new data path before migrations are completed.
- ☐ Runbooks explain how to diagnose missing telemetry.
- ☐ Observability logs and security audit logs are governed according to their distinct purposes.
- ☐ Operational teams know which backend-specific features reduce portability.
- ☐ Telemetry retention is appropriate for incident, compliance, and cost requirements.
- ☐ High-volume services have explicit sampling and cardinality plans.
- ☐ New services receive observability defaults through platform templates or onboarding standards.
- ☐ Telemetry quality is included in release readiness for critical systems.
- ☐ The observability architecture itself has an owner and a roadmap.
22. OpenTelemetry for AI and Agentic Systems
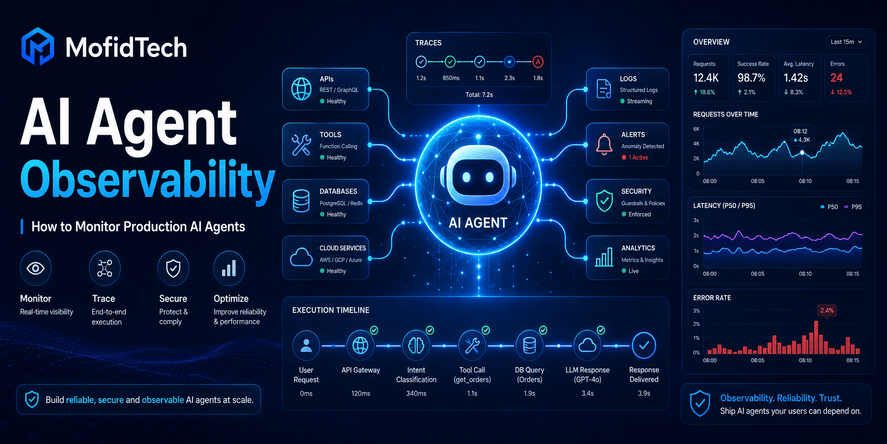
AI workloads create new observability challenges because a single user request may involve prompt preparation, retrieval, model calls, tool execution, agent planning, retries, safety checks, and external APIs. Traditional application metrics can tell teams that the request is slow or expensive, but they may not explain which model call, tool, or reasoning step caused the outcome.
OpenTelemetry’s emerging generative-AI semantic conventions aim to bring standard naming to these operations. This is strategically important for organizations that do not want every AI framework or model provider to create an incompatible observability model. The conventions are still evolving, so teams should pay attention to stability levels and avoid overcommitting to fields that may change.
The same privacy principles become even more important in AI systems. Prompts, responses, tool arguments, retrieved documents, and model metadata can contain sensitive or proprietary information. Capturing all of that content for debugging may create a greater risk than the operational benefit. Prefer metadata, bounded outcome categories, latency, model identity, token or usage summaries where appropriate, and carefully governed content capture only when there is a justified need.
22.1 What to observe in AI workflows
- End-to-end request latency and outcome.
- Model or provider dependency latency and error rate.
- Retry behavior and fallback paths.
- Tool calls and external service dependencies.
- Retrieval stages and data-source dependencies without unnecessarily exposing retrieved content.
- Usage or cost-related measurements needed for operational control.
- Safety or policy outcomes expressed as bounded categories rather than raw sensitive content.
- Trace continuity across orchestration, model, and tool boundaries.
23. Profiles and the Future of Unified Telemetry
OpenTelemetry’s expansion into profiles indicates a broader direction: observability signals are becoming more connected. Traces explain a request path, metrics summarize system behavior, logs preserve detailed events, and profiles reveal code-level resource use. The more consistently these signals share resource and execution context, the faster engineers can move from symptom to cause.
Teams should nevertheless distinguish project-level maturity from signal-level maturity. OpenTelemetry as a project is graduated, but individual components, semantic conventions, and newer signals may have different stability levels. Production architecture should evaluate the maturity of the exact capabilities being adopted rather than assuming every item in the ecosystem is equally stable.
24. Frequently Asked Questions
What is OpenTelemetry in simple terms?
OpenTelemetry is an open standard and toolkit for producing, collecting, processing, and exporting observability data such as traces, metrics, and logs. It helps applications describe operational behavior consistently without tying instrumentation to one observability backend.
Is OpenTelemetry an observability backend?
No. OpenTelemetry does not replace the system that stores, queries, visualizes, and alerts on telemetry. It standardizes the data and the collection pipeline that feeds those systems.
Why should a small team use OpenTelemetry?
A small team may benefit from consistent instrumentation and easier backend portability, but it should avoid building an unnecessarily complex Collector platform. Start with simple architecture and adopt only the components that solve current problems.
Do I need the OpenTelemetry Collector?
Not in every scenario, but the Collector is strongly useful in production because it centralizes processing, routing, batching, filtering, enrichment, security controls, and backend connectivity. The value grows as the number of services and destinations increases.
What is the difference between traces, metrics, and logs?
Traces show the path and timing of individual distributed operations. Metrics summarize behavior over time and support alerting and trends. Logs record detailed events. The strongest observability systems correlate these signals instead of treating them as unrelated data.
Does OpenTelemetry eliminate vendor lock-in?
It reduces instrumentation and protocol lock-in, especially at the application boundary. It does not eliminate dependence on backend-specific dashboards, queries, alerts, sampling, or storage behavior. Portability should be treated as a spectrum.
How does OpenTelemetry control observability cost?
OpenTelemetry provides architectural points where teams can reduce unnecessary telemetry through sampling, filtering, batching, routing, and cardinality discipline. Cost control still requires measurement, retention policy, and backend-specific economics.
What is metric cardinality and why does it matter?
Metric cardinality is the number of unique attribute combinations associated with a metric. Very high cardinality can increase memory, storage, and query cost and may make attribute-level analysis unreliable when limits are reached.
What is the difference between head sampling and tail sampling?
Head sampling decides early and is efficient but cannot see how a full trace ends. Tail sampling decides after observing more of the trace, allowing policies based on errors, latency, or other outcomes, but it requires more state and operational complexity.
Can OpenTelemetry leak sensitive data?
Yes, if applications or instrumentation capture personal information, secrets, raw URLs, request content, or other sensitive fields. OpenTelemetry cannot automatically know what is sensitive in every organization, so teams must apply data minimization, filtering, redaction, access control, encryption, and retention policy.
Is OpenTelemetry only for Kubernetes and microservices?
No. It is commonly associated with cloud-native systems, but the concepts also apply to monoliths, virtual machines, serverless applications, hybrid environments, and other distributed systems. The architecture should match the actual environment rather than imitate a Kubernetes pattern unnecessarily.
How should a company start adopting OpenTelemetry?
Begin with an inventory of current telemetry, define a small set of naming and privacy standards, choose a representative pilot, validate data quality and alerts, then expand gradually. Avoid a big-bang replacement unless the environment is very small.
What should be monitored about the OpenTelemetry Collector itself?
Monitor receive rate, processing latency, memory and CPU use, queue utilization, dropped data, export failures, retries, and backend connectivity. The telemetry pipeline must be observable because missing telemetry can otherwise be mistaken for healthy systems.
Is OpenTelemetry relevant for AI applications?
Yes. AI workflows benefit from distributed tracing, dependency metrics, cost and usage measurements, and emerging generative-AI semantic conventions. Teams should be especially careful about prompt, response, tool, and retrieved-content privacy.
What changed in 2026 for OpenTelemetry?
OpenTelemetry became a CNCF graduated project in May 2026. Profiles entered public alpha in March 2026, and the ecosystem continues to expand guidance around production concerns such as Collector operations and metric cardinality. These milestones make 2026 a particularly relevant year for architecture-focused adoption.
25. Conclusion
OpenTelemetry is most valuable when it is treated as architecture rather than instrumentation. The project provides standardized signals, context propagation, semantic conventions, a vendor-neutral protocol, and a Collector that can act as a telemetry policy layer. Those pieces create the possibility of unified observability, but the quality of the outcome depends on engineering decisions around naming, cardinality, sampling, security, reliability, cost, and ownership.
A successful design does not collect everything. It collects the evidence needed to answer important operational questions. It does not force every team to become observability specialists. It gives teams consistent defaults and a platform that makes the right behavior easier. It does not promise zero vendor dependency. It protects the application instrumentation boundary so that backend choices remain changeable.
For most organizations, the practical path is incremental: standardize service identity, establish baseline instrumentation, add the Collector where it provides clear value, correlate traces with logs and metrics, govern sensitive data, control metric cardinality, and introduce sampling based on real traffic and incident needs. Then expand the architecture as experience reveals where additional complexity is justified.
OpenTelemetry’s CNCF graduation in 2026 makes the framework a stronger long-term foundation, but the real reason to adopt it is more durable: modern systems need a common language for operational evidence. When traces, metrics, logs, and emerging signals share that language, engineers can spend less time assembling fragmented clues and more time understanding and improving the systems they operate.



💬 Comments
No comments yet. Be the first to comment!
Login to comment.