Chapter 5 — Loading and Inspecting Data
Chapter overview
A machine learning model can only learn from the data that reaches it. Before cleaning, feature engineering, splitting, or modeling, a practitioner must load the source correctly and understand what has actually been loaded. A silent encoding error, an incorrectly parsed date, a column interpreted as text, duplicated observations, or an undocumented missing-value symbol can invalidate every later result.
This chapter develops a reliable first-contact workflow for tabular data. Students learn how to recognize common data sources, use pandas readers safely, control parsing decisions, inspect DataFrame structure and content, and summarize the first evidence of quality problems. A deliberately imperfect customer-retention dataset is used throughout to demonstrate realistic issues such as mixed missing-value symbols, duplicated rows, invalid ages, inconsistent categories, and an imbalanced target.
Learning objectives
- Identify the strengths, limitations, and typical risks of files, databases, APIs, measurements, sensors, logs, and public datasets.
- Load CSV and Excel files with pandas while controlling separators, encodings, selected columns, date parsing, missing-value symbols, and memory use.
- Explain the difference between a source schema and the DataFrame schema inferred by pandas.
- Inspect dimensions, column names, data types, first and last records, summary statistics, uniqueness, missingness, duplicates, and target distribution.
- Use essential pandas operations confidently and interpret their outputs rather than merely executing them.
- Detect early warning signs such as identifier leakage, mixed units, impossible values, duplicated entities, target imbalance, and inconsistent categories.
- Create a reusable initial data-quality report before any destructive cleaning operation.
- Document loading assumptions so that another analyst can reproduce the same DataFrame.
Running dataset
Column | Meaning | Expected type | Possible issue |
|---|---|---|---|
| customer_id | Stable customer identifier | string | Duplicates or leading zeros |
| signup_date | Date the account was created | date | Mixed formats or invalid dates |
| age | Customer age in years | numeric | Missing or impossible values |
| monthly_spend | Average monthly spend | numeric | Currency symbols or negative values |
| contract_type | Month-to-month, annual, or two-year | category | Spelling and capitalization variants |
| support_calls | Calls during the observation period | integer | Stored as text or missing |
| region | Operational region | category | Rare and unknown categories |
| churned | Whether the customer left | binary target | Class imbalance or ambiguous labels |
Chapter map
Section | Purpose |
|---|---|
| 5.1 Common data sources | Understand where machine learning data comes from and what can go wrong before loading. |
| 5.2 Loading data with pandas | Control readers, schemas, encodings, dates, missing-value conventions, and large-file strategies. |
| 5.3 Initial dataset inspection | Build a structured understanding of rows, columns, types, values, quality risks, and target balance. |
| 5.4 Essential pandas operations | Master the core inspection methods and know when each operation is appropriate. |
| Practical lab | Load an imperfect dataset and produce a reproducible initial data-quality report. |
| Deliverable | Submit a notebook with dimensions, feature and target descriptions, missingness, duplicates, and identified risks. |
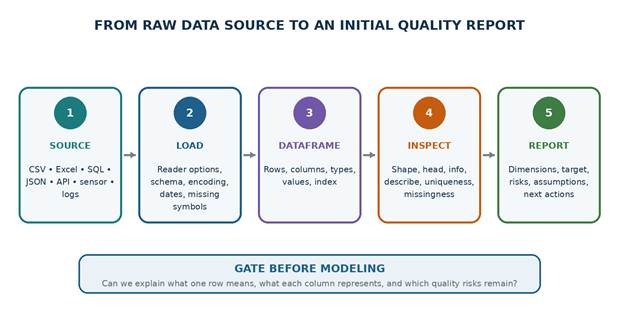
Figure 5.1 — The first-contact data workflow, from source acquisition to a documented quality report.
5.1 Common Data Sources
Machine learning datasets are produced by operational systems, experiments, devices, users, and public institutions. The storage format is only one part of the source. A responsible analyst also asks who created the data, why it was collected, which population it represents, how frequently it changes, and whether the meaning of fields remained stable over time.
KEY IDEA Source is more than format Two CSV files can have completely different reliability. One may be a carefully versioned export from an authoritative database; the other may be a manually edited spreadsheet saved as CSV. Evaluate provenance, ownership, update process, and semantics in addition to file extension. |
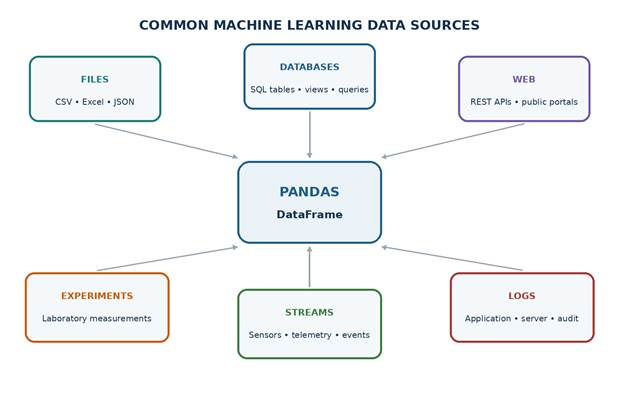
Figure 5.2 — Multiple source types can be transformed into a pandas DataFrame, but each requires different controls.
5.1.1 Questions to ask about every source
- Provenance: Who created the data and which system is considered authoritative?
- Collection purpose: Was the data collected for prediction, billing, research, auditing, or another objective?
- Population: Which people, machines, transactions, or periods are included or excluded?
- Granularity: What does one record represent, and can the same entity appear multiple times?
- Time coverage: What period is covered, and are there gaps or changes in collection policy?
- Update behavior: Is the source static, append-only, corrected retrospectively, or continuously overwritten?
- Schema stability: Can columns, units, codes, or category meanings change between versions?
- Access and governance: Who may use the data, for what purpose, and under which privacy or security restrictions?
- Label quality: How are targets created, verified, delayed, disputed, or corrected?
- Reproducibility: Can the exact source version be identified and loaded again?
5.1.2 CSV files
Comma-separated values files are plain-text tables. They are widely supported, easy to inspect, and convenient for exchange. Despite the name, the delimiter may be a comma, semicolon, tab, pipe, or another character. CSV files do not formally preserve data types, formulas, relationships, formatting, units, or validation rules; readers must infer or be told how to interpret every field.
Strength | Risk | Control |
|---|---|---|
| Portable and human-readable | Delimiter differs from expectation | Set sep explicitly and verify column count. |
| Works with almost every tool | Encoding corrupts names or symbols | Know the source encoding; test UTF-8 first. |
| Efficient for flat tables | Dates and numbers are stored as text | Declare parse_dates, dtype, decimal, or converters. |
| Easy to version when stable | Embedded separators and quotes can break rows | Inspect quoting, escape characters, and malformed lines. |
| Simple to stream in chunks | No built-in schema or relational constraints | Maintain a separate data dictionary and validation rules. |
5.1.3 Excel files
Excel workbooks can contain multiple sheets, formulas, merged cells, hidden rows, comments, manually formatted regions, and mixed data types. They are useful for analyst-maintained datasets and reports, but the visible workbook is not always a clean rectangular table. A loading plan should identify the exact sheet, header row, data range, and treatment of formulas.
- Specify sheet_name rather than relying on the first sheet.
- Use header, skiprows, nrows, and usecols to isolate the intended table.
- Check whether cells contain formulas and whether cached values are current.
- Treat formatting colors and merged headings as presentation, not data, unless explicitly encoded.
- Avoid using a workbook as a multi-user transactional database.
- Record the workbook version because manual edits may not be auditable.
5.1.4 Relational databases
Relational databases store data in tables linked by keys and queried with SQL. They can enforce types, constraints, uniqueness, and relationships more reliably than flat files. However, the query itself becomes part of the dataset definition: joins, filters, aggregation, time boundaries, and duplicate-producing relationships must be reviewed and versioned.
Database concern | Why it matters for ML |
|---|---|
| Join cardinality | A one-to-many join can duplicate the unit of observation and distort statistics. |
| Snapshot time | A live query today may return different records tomorrow. |
| Slow-changing dimensions | Customer or product attributes may have changed after the prediction time. |
| NULL semantics | SQL NULL, empty string, zero, and unknown category are different states. |
| Permissions and row-level security | Two analysts may receive different populations from the same query. |
| Query performance | Unbounded extraction can overload operational systems or exceed memory. |
5.1.5 JSON files
JSON represents nested objects and arrays rather than only flat tables. It is common in APIs, application exports, and event data. The analyst must decide how to normalize nested fields, preserve repeated structures, handle optional keys, and distinguish missing keys from keys whose value is null.
PYTHON • EXAMPLE 5.1 — NORMALIZE NESTED JSON RECORDS import pandas as pd json_normalize flattens nested dictionaries. Repeated arrays may require a separate table rather than forcing every object into one row. |
5.1.6 Web APIs
A web API provides data through requests, often as JSON. API loading requires more than a URL: authentication, pagination, rate limits, retries, timeouts, response status checks, schema evolution, and caching must be managed. Store the retrieval timestamp and parameters because the same endpoint may return different data later.
- Use a timeout; never allow requests to wait indefinitely.
- Check HTTP status codes and validate the response content type.
- Handle pagination explicitly so that all records are retrieved once.
- Respect rate limits and terms of service.
- Do not place secret API keys directly in notebooks or shared code.
- Cache raw responses or save a versioned snapshot when reproducibility is required.
- Validate the schema because API fields may be renamed, removed, or nested differently.
PYTHON • EXAMPLE 5.2 — LOAD PAGINATED API DATA DEFENSIVELY import os The example uses a placeholder endpoint. In a real project, also add bounded retries, logging, and a saved raw snapshot. |
5.1.7 Experimental measurements
Experimental data may be collected under controlled conditions, but it still requires metadata: instrument, calibration, protocol version, operator, units, sampling rate, treatment group, replicate identifier, and exclusion rules. A measurement without its context may be impossible to interpret or combine with another experiment.
Metadata item | Example | Risk if missing |
|---|---|---|
| Unit | Temperature in °C | Values from °F and °C may be mixed. |
| Sampling rate | 1,000 Hz | Signal features become incomparable. |
| Instrument calibration | Calibration certificate and date | Systematic measurement bias is hidden. |
| Replicate or subject ID | Patient P043, trial 2 | Dependent observations may be treated as independent. |
| Protocol version | Protocol v3.1 | Procedure changes can look like predictive patterns. |
| Quality flag | Sensor saturation detected | Invalid measurements may enter training. |
5.1.8 Sensors and telemetry
Sensors create time-stamped streams at high frequency. Raw sensor values often require synchronization, resampling, windowing, filtering, and aggregation before they become model rows. Device clocks, dropped packets, firmware changes, unit conversion, calibration drift, and replacement sensors can create distribution shifts.
CAUTION Raw events are not automatically samples For a predictive-maintenance model, one row may represent a five-minute sensor window, one machine cycle, or one machine at a scoring time. Define the window and aggregation rules before computing features. |
5.1.9 Logs
Application, server, security, and audit logs record events generated by systems. Logs may be semi-structured, duplicated during retries, rotated, sampled, delayed, or missing during outages. Message formats often change with software versions. Parsing rules and event-time versus ingestion-time semantics must be explicit.
- Identify a stable event identifier when possible.
- Separate event timestamp from log collection timestamp.
- Detect repeated messages caused by retries or replication.
- Track software version and message schema.
- Protect secrets and personal data that may appear in free-text messages.
- Do not interpret absence of a log entry as proof that an event did not occur unless logging completeness is guaranteed.
5.1.10 Public machine learning datasets
Public datasets are valuable for learning and benchmarking, but they are not automatically suitable for a real operational claim. Students should read the dataset card or documentation, identify the collection period and population, understand preprocessing already applied, and check license and usage conditions.
Question | Why ask it? |
|---|---|
| Is the dataset a raw source or a prepared benchmark? | Preprocessing may have removed missing values, identifiers, or difficult cases. |
| How old is it? | Historical patterns may not represent current behavior. |
| Which population is represented? | A model may not generalize to another region, device, institution, or user group. |
| Are train and test partitions predefined? | Ignoring official splits may create an incomparable or leaked benchmark. |
| What is the license? | Redistribution, commercial use, and derivative datasets may be restricted. |
| Are labels authoritative? | Crowdsourced or weak labels may contain systematic disagreement. |
5.1.11 Comparing common sources
Source | Main advantage | Typical risk | Useful pandas entry point |
|---|---|---|---|
| CSV | Portable flat exchange | No schema; delimiter and encoding issues | read_csv |
| Excel | Multiple human-readable sheets | Manual edits, formulas, merged layouts | read_excel |
| SQL database | Types, constraints, joins, scalable queries | Query leakage and changing snapshots | read_sql_query |
| JSON | Represents nested records | Variable schema and nested arrays | read_json / json_normalize |
| Web API | Current programmatic access | Pagination, rate limits, changing responses | requests + json_normalize |
| Sensors | Rich temporal measurements | Clock drift, gaps, volume, calibration | read_csv / stream-specific client |
| Logs | Detailed operational events | Schema drift, duplicates, missing events | read_json / read_csv |
| Public dataset | Fast learning and benchmarking | Representativeness and licensing | Dataset-specific loader |
5.2 Loading Data with pandas
pandas readers convert an external representation into a DataFrame. Loading is an interpretation step: the reader decides where the header is, how fields are separated, which strings represent missing values, which values are dates or numbers, and how malformed records are handled. These decisions should be explicit whenever they affect meaning or reproducibility.
5.2.1 A safe loading sequence
1. Identify and version the raw source without modifying it.
2. Inspect a small portion using a text editor, spreadsheet viewer, database client, or API sample.
3. Write a reader call with explicit path, sheet or query, delimiter, encoding, selected columns, and parsing rules.
4. Load a small sample first when the source is large or unfamiliar.
5. Verify row count, column count, names, data types, and representative values.
6. Record warnings, skipped records, or parser assumptions.
7. Only then load the full source and produce a quality report.
GOOD PRACTICE Preserve raw data Do not manually edit the only copy of a raw file to make it load. Save the original unchanged, document the issue, and apply corrections through reproducible code. |
5.2.2 File paths and reproducible projects
Hard-coded paths tied to one computer make notebooks difficult to reproduce. Use pathlib to construct paths relative to a project root, and keep raw, interim, processed, notebook, and model artifacts in separate locations.
PYTHON • EXAMPLE 5.3 — DEFINE PROJECT PATHS SAFELY from pathlib import Path In a packaged project, PROJECT_ROOT may be defined from a configuration file rather than the notebook working directory. |
5.2.3 read_csv()
read_csv() is one of the most configurable pandas functions. A minimal call may be sufficient for a clean UTF-8 comma-separated file, but production datasets often require several arguments.
Argument | Purpose | Example |
|---|---|---|
| filepath_or_buffer | Path, URL, or file-like object | "data/raw/customers.csv" |
| sep | Field separator | sep=";" or sep="\t" |
| header | Row containing column names | header=0 |
| names | Explicit column names | names=["id", "age", "target"] |
| usecols | Columns to load | usecols=["age", "spend", "churned"] |
| dtype | Requested data types | dtype={"customer_id": "string"} |
| parse_dates | Columns to parse as dates | parse_dates=["signup_date"] |
| na_values | Additional missing symbols | na_values=["?", "N/A", "unknown"] |
| encoding | Text character encoding | encoding="utf-8" |
| nrows | Maximum rows to read | nrows=1000 |
| chunksize | Rows per iterator chunk | chunksize=100_000 |
PYTHON • EXAMPLE 5.4 — LOAD A CONTROLLED CSV SCHEMA import pandas as pd Loading identifiers as strings preserves leading zeros and prevents meaningless arithmetic on identifier codes. |
5.2.4 Reading selected columns
usecols reduces memory use, speeds loading, and prevents unrelated fields from entering the analysis. It also acts as an early schema assertion. Selected columns can be specified by name, position, or a callable. The selection should still include any fields required to interpret the unit of observation, target, time, groups, and data quality.
PYTHON • EXAMPLE 5.5 — SELECT COLUMNS WITH A CALLABLE import pandas as pd A callable is convenient for wide tables, but explicitly list critical columns when schema control is more important than convenience. |
5.2.5 Specifying separators and decimal conventions
Many European exports use semicolons as field separators because commas are used as decimal marks. Tab-separated and pipe-separated files are also common. Verify that the parsed column count matches the data dictionary; a DataFrame with one giant column often indicates the wrong separator.
PYTHON • EXAMPLE 5.6 — READ A SEMICOLON FILE WITH DECIMAL COMMAS import pandas as pd Never replace all commas globally: commas may be delimiters, decimal marks, or legitimate text depending on the source. |
5.2.6 Handling encodings
An encoding maps bytes to characters. UTF-8 is the preferred modern default, but older exports may use Windows-1252, ISO-8859-1, or another locale-specific encoding. Incorrect decoding can raise an error or silently produce corrupted characters. Encoding problems are data quality problems because names, categories, and free text may change meaning.
Symptom | Possible cause | Response |
|---|---|---|
| UnicodeDecodeError | Reader used the wrong encoding | Confirm the source encoding; do not guess repeatedly without documentation. |
| Characters such as é or ا | Text was decoded using the wrong character mapping | Return to raw bytes and decode once with the correct encoding. |
| Replacement character � | Original bytes could not be decoded | Locate affected rows and obtain a clean source if possible. |
| Arabic or accented text displays correctly in source but not export | Export tool changed encoding | Control encoding during export and import; validate representative values. |
| Different files require different encodings | Heterogeneous legacy sources | Store encoding as source metadata and load each file explicitly. |
COMMON MISTAKE Avoid silent corruption encoding_errors="ignore" may make a file load by deleting undecodable bytes. It should not be a routine fix because the resulting text can be incomplete without warning. |
5.2.7 Parsing dates
Dates are often stored as strings, serial numbers, or mixed formats. A successful parse is not sufficient; the interpretation must also be correct. For example, 03/04/2026 can mean 3 April or 4 March. Prefer an unambiguous source format such as ISO 8601 and validate minimum, maximum, missingness, and impossible future dates.
PYTHON • EXAMPLE 5.7 — PARSE AND VALIDATE DATES EXPLICITLY import pandas as pd errors="coerce" converts invalid dates to NaT. This is useful only when invalid values are counted and investigated rather than silently forgotten. |
5.2.8 Defining missing-value symbols
A source may represent missingness using empty fields, NA, N/A, NULL, ?, -, 999, unknown, not applicable, or a domain-specific code. Not all special values mean the same thing. Unknown, not collected, refused, not applicable, and below detection limit may require different representations or indicator features.
Raw value | Possible meaning | Recommended action |
|---|---|---|
| Empty string | Not entered or exported as blank | Confirm field rules; generally map to missing. |
| N/A | Missing or not applicable | Disambiguate if the source uses both meanings. |
| 0 | Real zero or placeholder | Use domain rules; never automatically map every zero to missing. |
| -1 or 999 | Sentinel code | Confirm codebook and restrict mapping to the relevant column. |
| unknown | Explicit unknown category | May remain a meaningful category or be mapped to missing. |
| not applicable | Field does not conceptually apply | Consider a distinct category or structural missingness indicator. |
PYTHON • EXAMPLE 5.8 — USE COLUMN-SPECIFIC MISSING RULES import pandas as pd Only map a sentinel to missing after confirming that it cannot be a legitimate value in that column. |
5.2.9 read_excel()
read_excel() supports .xlsx and other workbook formats through an appropriate engine. It can read a single sheet, selected sheets, or all sheets. Loading every sheet returns a dictionary of DataFrames, which is useful for controlled workbook audits.
PYTHON • EXAMPLE 5.9 — LOAD AND VALIDATE AN EXCEL SHEET import pandas as pd The visible first row of a workbook may be a title rather than the actual header. Inspect sheet structure before choosing header and skiprows. |
5.2.10 Reading relational data
pandas can execute a SQL query and return the result as a DataFrame. Use a database connection managed by an approved driver or SQLAlchemy engine. Parameterize filter values instead of concatenating untrusted strings, and save the query text with the experiment.
PYTHON • EXAMPLE 5.10 — READ A PARAMETERIZED SQL QUERY import pandas as pd Credentials should come from a secret manager or environment configuration, not from source code. The connection string shown is illustrative. |
5.2.11 Reading large datasets
A file that is larger than available memory should not be loaded blindly. First inspect a sample, load only necessary columns, specify compact data types, and decide whether the analysis can be computed in chunks. Some tasks require an out-of-core framework or database aggregation rather than pandas alone.
Strategy | Use when | Important limitation |
|---|---|---|
| nrows | You need a quick structural sample | The first rows may not represent later values or categories. |
| usecols | Only a subset of fields is required | Do not omit identifiers or fields needed for validation. |
| dtype | Known schema can reduce memory | Incorrect type declarations can fail or hide invalid values. |
| chunksize | Statistics can be accumulated incrementally | Some operations require global state or a second pass. |
| Database aggregation | Source system can compute joins and summaries efficiently | Query logic must remain leakage-safe and reproducible. |
| Parquet or Arrow | Repeated analytical reads need typed columnar storage | Requires a controlled conversion from the original source. |
PYTHON • EXAMPLE 5.11 — INSPECT A LARGE CSV IN CHUNKS import pandas as pd Chunk processing is appropriate for additive summaries. Duplicates across chunk boundaries require a global strategy rather than checking each chunk independently. |
5.2.12 Loading validation checklist
Check | Evidence to record |
|---|---|
| Source identity | Path, database snapshot, API endpoint, dataset version, or checksum. |
| Reader configuration | Separator, encoding, sheet, query, selected columns, date and missing-value rules. |
| Expected schema | Required columns, intended data types, key fields, target, and unit of observation. |
| Observed dimensions | Rows and columns immediately after loading. |
| Parser warnings | Malformed records, skipped rows, invalid dates, conversion failures. |
| Representative values | Examples containing accents, non-Latin text, large values, missingness, and dates. |
| Reproducibility | Code, dependency versions, retrieval time, and immutable raw snapshot. |
5.3 Initial Dataset Inspection
Initial inspection is a structured audit, not a search for attractive plots. The objective is to understand what one row represents, identify the target and key features, verify the schema, quantify obvious quality problems, and decide what must be investigated before preprocessing or modeling.
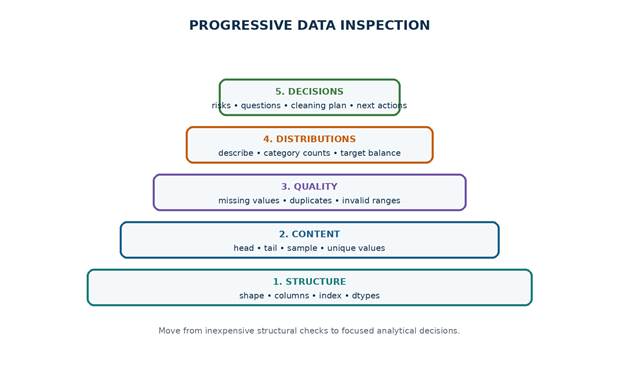
Figure 5.3 — Progressive inspection moves from basic structure to decisions about data preparation.
5.3.1 Number of rows and columns
df.shape returns a two-element tuple: number of rows and number of columns. The dimensions should be compared with source expectations. Unexpectedly few rows can indicate a filter, parsing failure, or incomplete extraction; unexpectedly many rows can indicate duplicated records or a one-to-many join.
- Record raw dimensions before removing anything.
- Compare row count with an authoritative source count when available.
- Check whether the row count represents unique entities or repeated observations.
- Interpret the number of columns relative to the data dictionary and usecols selection.
- Do not use a large row count as proof of a large effective sample size when rows are dependent.
5.3.2 Column names
Column names reveal schema quality. Look for duplicates, leading or trailing spaces, inconsistent capitalization, punctuation, unnamed columns created by spreadsheet exports, and fields that appear to reveal the target. Renaming may improve consistency, but preserve a mapping to the original source names.
PYTHON • EXAMPLE 5.12 — AUDIT COLUMN NAMES import re Normalize names through code and preserve the mapping. Do not silently rename two distinct source fields to the same normalized name. |
5.3.3 Data types
dtypes shows pandas storage types, while info() combines types with non-null counts and memory usage. An object or string column may contain categories, identifiers, dates, numbers mixed with symbols, or free text. An integer-looking column may become float because missing values are present. Type inspection should therefore be paired with representative values and conversion tests.
Observed type | Could represent | Inspection question |
|---|---|---|
| int64 / Int64 | Counts, codes, years, binary flags | Is arithmetic meaningful? Can values be missing? |
| float64 / Float64 | Continuous values or integers with missingness | Are decimals expected? Are sentinel values present? |
| object / string | Text, categories, IDs, dates, mixed types | What semantic type should this column have? |
| boolean / boolean | True/false flags | Are unknown states possible? |
| datetime64 | Dates and timestamps | What timezone, granularity, and valid range apply? |
| category | Finite repeated labels | Are categories ordered? Are unknown levels expected later? |
5.3.4 First, last, and sampled records
head() and tail() reveal obvious parsing problems, but they can be misleading when files are sorted. sample() selects records from across the DataFrame and is useful for varied inspection. Use a fixed random_state when the sample is included in a report so that collaborators see the same rows.
CAUTION Protect sensitive data Before displaying records in a notebook or report, consider whether names, emails, identifiers, free text, medical information, or other sensitive values should be masked or excluded. |
5.3.5 Summary statistics
describe() summarizes numerical columns by default and can also summarize categorical, date, and mixed data when include is specified. Statistics are signals for investigation: a minimum age of -5, a maximum monthly spend of 1,000,000, or a target mean of 0.03 may indicate invalid values, extreme observations, or imbalance.
Statistic | Interpretation | Potential warning |
|---|---|---|
| count | Number of non-missing observations | Differs strongly between columns. |
| mean | Arithmetic average | Distorted by extreme values or mixed units. |
| std | Standard deviation | Zero suggests a constant feature; very large may signal scale problems. |
| min / max | Observed range | Impossible or implausible domain values. |
| 25%, 50%, 75% | Quartiles and median | Large gaps suggest skewness, outliers, or groups. |
| unique | Number of distinct category values | Unexpectedly high cardinality or duplicated labels. |
| top / freq | Most common category and count | Dominant category may reduce information or reveal imbalance. |
5.3.6 Unique values and cardinality
nunique() counts distinct non-missing values by default, while unique() returns the actual values. Cardinality helps distinguish identifiers, binary flags, categories, ordinal variables, and continuous measurements. A supposed category with nearly as many values as rows may be an identifier or free-text field.
- Inspect actual values for low-cardinality columns.
- Use value_counts(dropna=False) to include missing values.
- Normalize whitespace and capitalization only after measuring the original inconsistency.
- Treat identifiers separately from predictive features.
- Investigate a target with unexpected labels such as Y, Yes, yes, 1, True, and trailing spaces.
5.3.7 Missing values
isna() identifies pandas missing values such as NaN, None in many contexts, and NaT for dates. The initial report should contain both counts and percentages. Missingness should be analyzed by column and, later, by rows, target, time, source, or group because a low global percentage can hide a concentrated problem.
PYTHON • EXAMPLE 5.13 — BUILD A MISSING-VALUE SUMMARY import pandas as pd A missing-value percentage does not explain why values are missing. It identifies where further domain investigation is needed. |
5.3.8 Duplicate rows
duplicated() detects exact duplicates across selected columns. Exact row duplication may result from repeated export, file concatenation, API pagination errors, retries, or legitimate repeated events. Duplicate entity identifiers are not necessarily duplicate rows; they may represent repeated visits, transactions, or time windows.
Duplicate concept | Example | Correct question |
|---|---|---|
| Exact row duplicate | Every field is identical | Was the record copied or is a repeated identical event legitimate? |
| Duplicate key | Same customer_id appears twice | Should the dataset contain one row per customer or repeated snapshots? |
| Near duplicate | Fields differ only by whitespace or spelling | Are these separate records or inconsistent representations? |
| Cross-split duplicate | Same entity or event appears in train and test | Could evaluation be inflated through memorization? |
| Time-dependent repeat | Same machine appears every hour | How should groups or time be respected during splitting? |
PYTHON • EXAMPLE 5.14 — INSPECT EXACT AND KEY DUPLICATES import pandas as pd Do not drop duplicates until the unit of observation and business key are confirmed. Repeated customer IDs may be expected in longitudinal data. |
5.3.9 Target distribution
The target distribution determines the type and difficulty of the learning problem. For classification, inspect every label, its count, and its percentage. For regression, inspect missingness, range, quantiles, skewness, repeated sentinel values, and extreme observations. The target must never be treated as just another feature.
Target type | Initial checks | Possible concern |
|---|---|---|
| Binary classification | Two valid labels, counts, percentages, missing labels | Severe imbalance or inconsistent encodings. |
| Multiclass classification | Class list, counts, rare classes, unknown class | Some classes have too few examples for reliable splitting. |
| Multilabel classification | Number of labels per sample and label prevalence | Some combinations or labels are extremely rare. |
| Regression | Range, quantiles, histogram, missingness, units | Skewness, censoring, mixed units, impossible values. |
| Ordinal target | Ordered levels and counts | Order is lost or categories are merged inconsistently. |
PYTHON • EXAMPLE 5.15 — INSPECT A CLASSIFICATION TARGET import pandas as pd Normalize labels for validation, but keep the original values available so that the source inconsistency can be documented. |
5.3.10 Potential data-quality problems
An initial quality report should separate observed evidence from hypotheses. For example, “age contains values below zero” is observed evidence; “negative ages were probably used as missing-value codes” is a hypothesis requiring confirmation.
Observed signal | Possible explanations | Next action |
|---|---|---|
| One unnamed column | Saved spreadsheet index or blank header | Compare values with row index and source layout. |
| Object type for monthly_spend | Currency symbols, decimal commas, or mixed text | Inspect invalid conversion examples. |
| Many missing signup dates | Legacy system or parsing failure | Compare raw strings and collection period. |
| Repeated customer IDs | Longitudinal records or accidental duplication | Confirm the unit of observation and timestamps. |
| Age maximum is 999 | Sentinel value or input error | Check codebook and count affected records. |
| Target has 2% positives | Rare event or missing positive labels | Choose metrics and split strategy only after label audit. |
| Region predicts target almost perfectly | Real operational difference or leakage/proxy | Review collection process and time availability. |
5.3.11 A compact automated inspection function
PYTHON • EXAMPLE 5.16 — GENERATE AN INITIAL DATAFRAME PROFILE from __future__ import annotations Automated profiles accelerate inspection but do not replace domain interpretation, source documentation, or targeted validation rules. |
5.4 Essential pandas Operations
The following operations form a compact inspection vocabulary. Students should know not only the syntax but also what each result can and cannot establish. Most operations are non-destructive, making them appropriate before cleaning decisions are finalized.
5.4.1 head() and tail()
Operation | Returns | Typical use | Limitation |
|---|---|---|---|
| df.head(n) | First n rows; default 5 | Check headers, parsing, and early values | May show only one sorted period or group. |
| df.tail(n) | Last n rows; default 5 | Check footer artifacts and final records | Still not a representative sample. |
| df.sample(n, random_state=...) | Random rows | Inspect varied records reproducibly | Rare problems may not appear in a small sample. |
5.4.2 shape, columns, and dtypes
Operation | Question answered | Example interpretation |
|---|---|---|
| df.shape | How many rows and columns were loaded? | (25_000, 8) means 25,000 observations and 8 fields. |
| df.columns | What are the exact field names and order? | Leading spaces or Unnamed: 0 indicate schema issues. |
| df.dtypes | How is each column currently stored? | object for age suggests mixed or non-numeric values. |
5.4.3 info()
info() writes a concise summary containing index range, columns, non-null counts, dtypes, and approximate memory usage. Because it prints rather than returning a normal DataFrame, capture it in a string when the result must be stored in a report.
PYTHON • EXAMPLE 5.17 — CAPTURE DF.INFO() AS REPORT TEXT from io import StringIO memory_usage="deep" provides a more realistic estimate for object or string columns, although it can take longer on large data. |
5.4.4 describe()
describe() summarizes numerical columns by default. Use include="all" for a broad profile, but interpret type-specific statistics carefully. Percentiles can be customized when tails are important.
PYTHON • EXAMPLE 5.18 — CREATE NUMERIC AND CATEGORICAL SUMMARIES numeric_summary = customer_df.describe( Transposing with .T places one feature per row, which is often easier to review and export. |
5.4.5 value_counts()
value_counts() counts occurrences of each distinct value. It is essential for categorical features, binary flags, target distributions, missing-value codes, and low-cardinality numerical fields. Use dropna=False to keep missing values visible and normalize=True for proportions.
PYTHON • EXAMPLE 5.19 — COMPARE CATEGORY COUNTS AND PERCENTAGES column = "contract_type" Review raw categories before normalizing spelling or capitalization so that source inconsistencies remain measurable. |
5.4.6 nunique() and unique()
nunique() efficiently summarizes cardinality across columns. unique() is useful for inspecting actual values when cardinality is small. Avoid printing thousands of unique values; filter or sample them instead.
PYTHON • EXAMPLE 5.20 — FIND LOW- AND HIGH-CARDINALITY COLUMNS unique_counts = customer_df.nunique(dropna=True).sort_values() High cardinality is a clue, not proof of an identifier. Continuous measurements may also have nearly unique values. |
5.4.7 isna()
isna() returns a Boolean DataFrame. It can be reduced by sum() for counts or mean() for proportions. Missingness can also be inspected by row to find records with many absent fields.
PYTHON • EXAMPLE 5.21 — INSPECT MISSINGNESS BY COLUMN AND ROW column_missing = ( A row with many missing features may still be valid. Investigate source and business context before deleting it. |
5.4.8 duplicated()
duplicated() returns a Boolean Series. By default, the first occurrence is considered unique and later occurrences are marked duplicate. keep=False marks every member of a duplicate group, which is better for investigation.
PYTHON • EXAMPLE 5.22 — SUMMARIZE DUPLICATE GROUPS key = ["customer_id"] A key duplicate report should be interpreted against the declared unit of observation. One row per transaction naturally repeats customer_id. |
5.4.9 Quick-reference table
Operation | Primary output | Use it to detect |
|---|---|---|
| head() / tail() | Selected records | Parsing errors, header/footer artifacts, obvious anomalies |
| shape | Tuple (rows, columns) | Incomplete extraction, join explosion, unexpected schema width |
| columns | Index of names | Spaces, duplicates, unnamed fields, unexpected features |
| dtypes | Type per column | Numeric text, date text, inappropriate identifiers |
| info() | Compact schema summary | Non-null counts, memory, mixed storage types |
| describe() | Distribution statistics | Ranges, skewness, constants, extreme values |
| value_counts() | Counts by distinct value | Rare categories, inconsistent labels, target imbalance |
| nunique() | Distinct counts | Identifiers, constants, unexpected cardinality |
| isna() | Missingness mask | Columns or rows with incomplete data |
| duplicated() | Duplicate mask | Repeated rows, keys, entities, or events |
5.4.10 A recommended inspection sequence
1. Confirm the DataFrame object exists and is not empty.
2. Record shape and compare it with source expectations.
3. Inspect exact column names and check for duplicates.
4. Review dtypes and capture info().
5. Display head(), tail(), and a reproducible sample after masking sensitive fields.
6. Generate numerical and categorical describe() tables.
7. Count unique values and inspect low-cardinality columns.
8. Calculate missing-value counts and percentages.
9. Investigate exact duplicates and duplicates of the intended business key.
10. Inspect the target distribution and invalid labels.
11. Write observed problems, hypotheses, and required domain questions.
12. Save the report before modifying the raw DataFrame.
Practical Lab — Produce an Initial Data-Quality Report
PRACTICAL LAB Lab objective Load a deliberately imperfect customer dataset, verify the schema, inspect its structure and target, and produce a concise report that distinguishes observed evidence from recommended next actions. |
Scenario
A telecommunications company wants to predict customer churn. An analyst receives a CSV export created by combining several operational systems. Before any cleaning or model training, the team needs an initial data-quality report. The target is churned, and the intended unit of observation is one customer at a fixed snapshot date.
Learning tasks
1. Create or obtain the raw CSV file and preserve it without manual edits.
2. Load the dataset with explicit encoding, missing-value rules, selected columns, and date parsing.
3. Report the number of rows and columns and list all fields.
4. Describe the semantic role and current pandas type of each feature.
5. Inspect first, last, and sampled records.
6. Produce numerical and categorical summary tables.
7. Calculate unique-value counts and identify possible identifiers, constants, and inconsistent categories.
8. Calculate missing-value counts and percentages.
9. Identify exact duplicates and repeated customer identifiers.
10. Describe the target and calculate class counts and percentages.
11. List potential quality problems, supporting evidence, and the domain question or next action for each.
12. Save the notebook outputs and report tables in a reproducible project folder.
Step 1 — Create the deliberately imperfect practice file
PYTHON • LAB SETUP — GENERATE THE RAW CSV from pathlib import Path The duplicated fifth customer is an exact duplicate. Other problems include invalid dates, mixed numeric/text values, inconsistent categories, missing values, and implausible ranges. |
Step 2 — Load without hiding conversion problems
PYTHON • LAB LOADING — PRESERVE RAW EVIDENCE import pandas as pd Separate raw and parsed columns during diagnosis. Later cleaning can replace the raw field after invalid values have been documented. |
Step 3 — Produce core report tables
PYTHON • LAB ANALYSIS — GENERATE REPORT COMPONENTS from io import StringIO The lab is intentionally small enough for manual verification. Students should compare automated outputs with the actual rows. |
Step 4 — Record evidence and next actions
Observed evidence | Risk or interpretation | Required action |
|---|---|---|
| One exact duplicate row for customer 005 | Sample size and category counts are inflated | Confirm export duplication; remove only after verification. |
| signup_date contains invalid and impossible dates | Temporal features and cohort analysis would be wrong | Review raw values and source date rules. |
| age contains 999 and -3 | Sentinel or entry error; summary statistics are distorted | Confirm valid range and sentinel codes. |
| support_calls contains the string "three" | Numeric conversion will fail or produce missingness | Define conversion and invalid-value policy. |
| contract_type has capitalization, spaces, and synonyms | One concept appears as several categories | Create a documented category mapping. |
| monthly_spend includes -15 | May be a credit, refund, or invalid value | Ask whether negative spend is valid in this definition. |
| churned includes Yes, YES, No, and missing | Target labels are inconsistent and incomplete | Confirm label mapping and policy for unknown outcomes. |
| customer_id must retain leading zeros | Numeric loading would change the identifier | Keep as string and validate uniqueness after deduplication. |
Expected lab output
- A reproducible notebook that runs from top to bottom without manual edits.
- A loading cell containing explicit path, encoding, selected columns, missing-value rules, and date handling.
- A table describing each field, its semantic role, pandas type, and expected type.
- A dimensions and schema summary.
- A missing-value table with counts and percentages.
- A duplicate summary distinguishing exact duplicates from repeated identifiers.
- A target distribution table with missing labels included.
- A list of potential quality problems supported by observed values.
- A prioritized list of questions or actions required before data cleaning and model training.
Suggested solution summary
A strong submission should report that the practice data contain 10 rows before cleaning, one exact duplicate, several invalid or ambiguous values, inconsistent categorical labels, and an incomplete target. It should not immediately “fix” these problems without recording the source evidence. The analyst should preserve customer_id as a string, distinguish raw and parsed signup dates, validate age and spend using domain rules, normalize categories through an explicit mapping, and confirm the intended label definition before constructing the final modeling table.
Deliverable — Initial Data-Quality Notebook
The notebook should be understandable by another analyst who has not seen the source before. Use short Markdown explanations before each code section and interpret the output after it. The deliverable is not complete when code runs; it is complete when the dataset and its known limitations are clearly documented.
Required notebook structure
Section | Required content |
|---|---|
| 1. Context and source | Dataset purpose, source owner, file or query version, retrieval date, unit of observation, and target. |
| 2. Loading configuration | Path or query, reader function, separator, encoding, selected columns, date handling, missing symbols, and dependencies. |
| 3. Dataset dimensions | Rows, columns, expected counts, and explanation of any mismatch. |
| 4. Feature descriptions | Data dictionary with source name, meaning, role, expected type, observed type, and units. |
| 5. Target description | Target definition, valid labels or units, missingness, counts, percentages, and known delay or ambiguity. |
| 6. Missing-value summary | Counts and percentages by feature, plus notes on suspected missingness mechanisms. |
| 7. Duplicate summary | Exact duplicate count, key duplicates, unit-of-observation interpretation, and proposed verification. |
| 8. Potential quality problems | Observed evidence, possible impact, domain question, and recommended next action. |
| 9. Reproducibility appendix | Python and library versions, project paths, saved report tables, and raw-data integrity note. |
Feature-description template
Field | Meaning | Role | Expected type | Observed type | Units / valid values | Initial issue |
|---|---|---|---|---|---|---|
| customer_id | Customer identifier | Key | string | string | Unique stable code | Repeated values |
| signup_date | Account creation date | Feature/time | date | object | ISO date | Invalid strings |
| age | Age at snapshot | Feature | numeric | object | 18–120 years | Sentinel and negative values |
| churned | Customer left service | Target | binary | object | Yes / No | Case variants and missing |
Quality-problem log template
ID | Observed evidence | Affected fields / rows | Potential impact | Question or action | Status |
|---|---|---|---|---|---|
| Q-01 | Describe the exact evidence | Columns, values, counts, IDs | How analysis or modeling may be affected | Who must confirm or what code must test | Open |
| Q-02 | Describe the exact evidence | Columns, values, counts, IDs | How analysis or modeling may be affected | Who must confirm or what code must test | Open |
| Q-03 | Describe the exact evidence | Columns, values, counts, IDs | How analysis or modeling may be affected | Who must confirm or what code must test | Open |
Assessment rubric
Criterion | Excellent | Needs improvement | Weight |
|---|---|---|---|
| Loading reproducibility | All source and parsing assumptions are explicit; raw data are preserved. | Manual edits, hidden paths, or unexplained defaults. | 20% |
| Schema understanding | Every field, type, unit, key, and target role is described accurately. | Descriptions are incomplete or confuse storage type with meaning. | 20% |
| Inspection completeness | All required dimensions, summaries, missingness, duplicates, and target checks are present. | Important checks are absent or outputs are not interpreted. | 25% |
| Evidence-based reasoning | Problems are supported by counts or values and separated from hypotheses. | Claims are vague or unsupported. | 20% |
| Communication and organization | Notebook is clear, reproducible, and professionally structured. | Outputs are disorganized or difficult to reproduce. | 15% |
Submission checklist
- The notebook starts from the unchanged raw source.
- All paths and dependencies required to run the notebook are documented.
- The source, retrieval date, unit of observation, and target are stated.
- The loading cell uses explicit options where meaning could otherwise change.
- Dimensions and columns are compared with expectations.
- Data types are interpreted semantically.
- Missing values include both counts and percentages.
- Duplicates are evaluated using both all columns and the intended business key.
- The target distribution includes missing and unexpected values.
- Potential problems are stated as evidence, impact, and next action.
- No destructive cleaning step is performed before the initial report is saved.
- Sensitive records are not unnecessarily displayed or exported.
Chapter Summary
Loading and inspection establish the factual basis for every later machine learning step. Data readers are not neutral: separators, encodings, date formats, missing-value symbols, selected columns, and queries determine the DataFrame that models will eventually see. A disciplined analyst preserves raw data, makes parsing choices explicit, checks the observed schema against expectations, and records warnings or invalid values.
Initial inspection progresses from structure to meaning: dimensions, columns, types, sample records, distributions, unique values, missingness, duplicates, and target balance. The goal is not to clean everything immediately, but to produce an evidence-based quality report and a prioritized list of questions that must be resolved before modeling.
Key terminology
Term | Meaning |
|---|---|
| Data source | The system, file, service, experiment, or process from which data are obtained. |
| Schema | The expected fields, data types, keys, constraints, and relationships. |
| DataFrame | A labeled two-dimensional pandas data structure containing rows and columns. |
| Encoding | A mapping between bytes and characters, such as UTF-8. |
| Delimiter | The character separating fields in a text table. |
| Missing-value symbol | A raw value used to represent unavailable, unknown, or inapplicable data. |
| Cardinality | The number of distinct values in a field. |
| Business key | One or more fields intended to identify the unit of observation. |
| Exact duplicate | A row whose selected field values are identical to another row. |
| Target distribution | Counts or statistical distribution of the outcome to be predicted. |
| Data provenance | The origin, ownership, collection process, and history of a dataset. |
| Data-quality report | A documented summary of schema, completeness, uniqueness, validity, and known risks. |
Knowledge check
1. Why can a CSV file load successfully and still be interpreted incorrectly?
2. When should customer_id be loaded as a string rather than an integer?
3. What is the difference between an exact duplicate and a repeated business key?
4. Why should invalid dates sometimes be parsed with errors="coerce" into a separate column?
5. How do value_counts(dropna=False) and nunique() answer different questions?
6. Why is accuracy not yet relevant during initial data inspection?
7. What evidence would suggest that the wrong delimiter was used?
8. Why should a target distribution include missing labels?
9. What additional controls are required when loading data from a web API?
10. Why should an analyst save an initial quality report before cleaning?
Suggested answers
1. The reader may infer the wrong delimiter, encoding, date interpretation, numeric convention, missing symbols, or types without raising an error.
2. Identifiers are labels rather than quantities; string storage preserves leading zeros and prevents meaningless arithmetic.
3. An exact duplicate matches on all selected fields, while a repeated key may be legitimate when one entity has multiple transactions, visits, or snapshots.
4. It preserves the original raw string while making parse failures measurable as NaT; invalid values can then be investigated explicitly.
5. value_counts reports the frequency of each value, whereas nunique reports only how many distinct non-missing values exist.
6. Accuracy evaluates predictions; initial inspection occurs before a valid model and focuses on understanding data and labels.
7. The result may contain one unexpectedly wide text column or a column count that does not match the schema.
8. Missing outcomes can change the apparent class balance and may reveal delayed, censored, or selectively observed labels.
9. Authentication, pagination, timeouts, status checks, retries, rate limits, schema validation, and snapshotting for reproducibility.
10. The report preserves evidence about the raw source and prevents later transformations from hiding the original problems.
Short practical assignment
Choose a small public or institutional tabular dataset and create a two-page initial quality brief. Include the source and version, unit of observation, target, loading code, dimensions, schema table, missingness, duplicate analysis, target distribution, and five evidence-based quality observations. Do not perform final imputation, outlier removal, encoding, or model training.
Instructor notes and suggested timing
Session | Focus | Suggested activities | Duration |
|---|---|---|---|
| 1 | Source literacy | Compare CSV, Excel, database, API, sensor, log, and public dataset scenarios. | 90 min |
| 2 | CSV and Excel loading | Demonstrate separators, encodings, usecols, parse_dates, na_values, and sheet selection. | 120 min |
| 3 | Database, JSON, and API loading | Discuss query snapshots, nested records, pagination, and reproducibility. | 90 min |
| 4 | Structural inspection | Practice shape, columns, dtypes, info, head, tail, and sample. | 90 min |
| 5 | Quality inspection | Practice describe, value_counts, nunique, isna, duplicated, and target analysis. | 120 min |
| 6 | Guided practical lab | Students produce the full initial data-quality report. | 150 min |
| 7 | Peer review and correction | Exchange notebooks, verify evidence, and improve problem logs. | 90 min |
Readiness check before Chapter 6
- I can explain what one row represents and identify the target without consulting the code.
- I can reproduce the same DataFrame from an unchanged raw source.
- I can justify the selected separator, encoding, date rules, missing-value symbols, and data types.
- I have documented exact duplicates separately from repeated entities or events.
- I can describe the target distribution, including missing and unexpected labels.
- I have a prioritized quality-problem log containing evidence, impact, and next action.
- I have not allowed cleaning decisions to erase evidence about the original source.
KEY IDEA Next step Chapter 6 will use the initial quality report as the foundation for exploratory data analysis: distributions, feature-target relationships, correlations, unusual observations, and evidence-driven hypotheses. |