Introduction
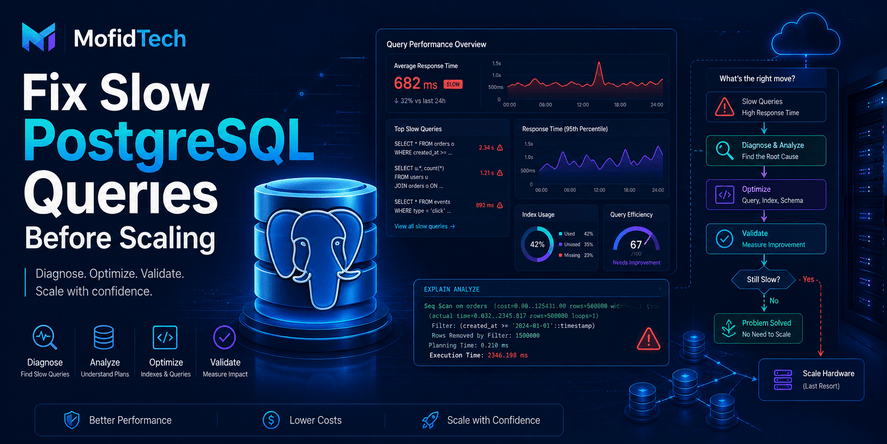
Slow PostgreSQL queries are one of the most common performance problems in modern web applications. A website may feel fast during development, work well with a few thousand records, and then suddenly become slow when real users, real traffic, and real data arrive. At that point, many teams immediately think about upgrading the server, adding more CPU, increasing memory, or moving to a bigger cloud database instance.
Sometimes scaling hardware is necessary. But in many cases, slow PostgreSQL queries are not caused by weak hardware. They are caused by missing indexes, inefficient query patterns, poor data modeling, expensive sorting, uncontrolled joins, growing tables, bad pagination, application-level database misuse, or lack of monitoring.
The important lesson is simple: before scaling PostgreSQL hardware, diagnose the real source of slowness.
Scaling too early can become expensive and misleading. A bigger server may hide the problem temporarily, but the same inefficient query can become slow again when the table grows, traffic increases, or new features add more database pressure. Good database performance starts with understanding how queries behave, how PostgreSQL reads data, how indexes help, and how application design affects the database.
This guide explains how to diagnose and fix slow PostgreSQL queries before scaling hardware. It is written for developers, backend engineers, Django developers, DevOps engineers, and students who want a practical, no-code understanding of PostgreSQL performance.
Table of Contents
- Why PostgreSQL Queries Become Slow
- What to Check Before Scaling Hardware
- How PostgreSQL Uses Indexes
- How to Think About Query Plans Without Being a DBA
- Common Causes of Slow PostgreSQL Queries
- Application-Level Problems That Affect PostgreSQL
- PostgreSQL Monitoring Signals Developers Should Understand
- Indexing Strategy for Real Applications
- When Caching Helps and When It Does Not
- When You Should Actually Scale PostgreSQL
- PostgreSQL Performance Tuning Checklist
- Common Mistakes to Avoid
- Security and Reliability Considerations
- Performance Considerations for Production Teams
- Troubleshooting Slow PostgreSQL Queries
- FAQ
- Conclusion
Why PostgreSQL Queries Become Slow
A PostgreSQL query becomes slow when the database needs too much time, memory, CPU, disk access, or coordination to return the requested result. The cause may be inside the query, inside the database structure, inside the application, or inside the infrastructure.
The most common mistake is assuming that slow queries always mean the server is too small. In reality, slow queries often come from inefficient access patterns.
A small table can hide bad design. A query that works perfectly on 1,000 rows may become painful on 10 million rows. Development data is usually clean, small, and predictable. Production data is bigger, messier, and used by many people at the same time.
Query Problems Versus Server Problems
There are two broad categories of PostgreSQL performance problems:
| Problem Type | Typical Cause | Common Fix |
|---|---|---|
| Query-level problem | Missing index, inefficient join, expensive sorting, bad filtering | Improve query design, indexing, or data model |
| Server-level problem | CPU saturation, memory pressure, slow disk, too many connections | Tune infrastructure, connection handling, or scale hardware |
| Application-level problem | Too many queries, N+1 patterns, unnecessary database calls | Improve backend logic and data access patterns |
| Data growth problem | Tables became much larger than expected | Add indexes, partition data, archive old data, redesign access patterns |
| Operational problem | No monitoring, outdated statistics, unexpected locks | Add observability and maintenance workflows |
Good diagnosis means identifying which category applies before choosing a solution.
Why Slow Queries Often Appear After Growth
A query can be acceptable for months and then suddenly become slow. This does not always mean PostgreSQL changed or failed. It often means the data crossed a threshold.
For example, filtering a table without a useful index may feel fast when the table has a few thousand rows. But when the table reaches millions of rows, PostgreSQL may need to inspect a large portion of the table to find matching records. The same query becomes slower because the amount of work increased.
Growth also affects sorting, pagination, reporting, dashboards, search pages, admin panels, and analytics features. These are often forgotten during early development because they do not seem dangerous at small scale.
Temporary Slowness Versus Structural Slowness
Not every slow query is a permanent problem. Some slowdowns are temporary:
- A backup is running.
- A large import is happening.
- The server is under unusual traffic.
- A maintenance job is using resources.
- A report is processing a large dataset.
- Another transaction is locking important rows.
Structural slowness is different. It happens repeatedly because the design or access pattern is inefficient. Structural problems require deeper fixes, not only waiting for the system to recover.
What Should You Check Before Scaling Hardware?
Before scaling PostgreSQL hardware, check whether the database is slow because of poor query behavior, missing indexes, excessive connections, memory pressure, disk I/O, table growth, or inefficient application access.
Scaling should not be the first reaction. It should be the result of diagnosis.
The First Question: Is the Database Doing Too Much Work?
A slow PostgreSQL query usually means the database is doing more work than necessary. That work may include:
- Reading too many rows.
- Sorting too much data.
- Joining large tables inefficiently.
- Filtering after reading instead of using indexes.
- Returning more columns than needed.
- Repeating the same lookup many times.
- Waiting for locks.
- Managing too many concurrent connections.
A good optimization workflow starts by reducing unnecessary work.
The Second Question: Is the Application Creating the Problem?
Sometimes PostgreSQL is not the real problem. The application is asking the database to do too much.
Common application-side issues include:
- Loading too many records for one page.
- Repeating queries inside loops.
- Fetching full objects when only summaries are needed.
- Running expensive queries on every request.
- Building dashboards that recalculate everything in real time.
- Using admin pages on large tables without filters.
- Allowing broad search forms without limits.
In these cases, upgrading the database server may help temporarily, but the application pattern remains inefficient.
The Third Question: Is the Infrastructure Actually Saturated?
Hardware scaling becomes more reasonable when real infrastructure limits are visible. Important signals include:
- CPU is consistently high during database activity.
- Memory pressure causes poor cache behavior.
- Disk I/O is saturated.
- Connection count is too high.
- Queries wait because resources are exhausted.
- Database performance degrades under normal traffic, not only unusual events.
If infrastructure is healthy but individual queries are slow, optimization should come before scaling.
How PostgreSQL Uses Indexes
Indexes help PostgreSQL find data faster without scanning every row in a table. A good index is like a well-organized reference system. Instead of reading the whole table, PostgreSQL can jump to the relevant part of the data.
However, indexes are not magic. They help specific query patterns, and they also add cost to writes, updates, storage, and maintenance.
Why Indexes Improve Some Queries
Indexes are most useful when a query filters, sorts, joins, or searches using columns that narrow the result significantly.
For example, if users frequently search by email, status, date, category, account, or foreign key, the right index can reduce the amount of data PostgreSQL must inspect.
Indexes are especially important for:
- User lookup pages.
- Login or account systems.
- Order history.
- Blog article filtering.
- Product catalogs.
- Admin dashboards.
- Search filters.
- Relationship joins.
- Date-based reporting.
- Multi-tenant applications.
Why an Index May Not Be Used
Developers are often surprised when they add an index and the query is still slow. PostgreSQL may ignore an index when it believes another strategy is cheaper.
Possible reasons include:
- The query returns a large percentage of the table.
- The index does not match the filter pattern.
- The column has low selectivity.
- The query applies transformations that reduce index usefulness.
- The table statistics are outdated.
- The index exists but not in the right column order.
- Sorting or joining still requires expensive work.
- The database decides a sequential scan is cheaper.
This is why indexing should be based on query behavior, not guesswork.
Why Too Many Indexes Can Hurt
Indexes improve reads but add cost to writes. Every time data is inserted, updated, or deleted, PostgreSQL may need to update related indexes.
Too many indexes can cause:
- Slower writes.
- More disk usage.
- Longer maintenance operations.
- Confusing optimization decisions.
- More overhead during imports and updates.
- Increased complexity for developers.
A healthy indexing strategy focuses on real query patterns, not indexing every column.
How to Think About Query Plans Without Being a DBA
A query plan explains how PostgreSQL intends to execute a query. Developers do not need to become full-time database administrators to benefit from query plans. They only need to understand the basic signals.
A query plan helps answer one important question: how much work is PostgreSQL doing to return this result?
Sequential Scan
A sequential scan means PostgreSQL reads through a table to find matching rows. This is not always bad. For small tables or queries that return many rows, it can be efficient.
It becomes a problem when PostgreSQL repeatedly scans a large table to return a small number of rows.
Index Scan
An index scan means PostgreSQL uses an index to locate relevant data. This is often good when a query is selective.
However, an index scan is not automatically perfect. PostgreSQL may still need to visit many rows, fetch table data, sort results, or perform expensive joins.
Join Strategy
Joins connect data across tables. Poor joins can become expensive when tables are large or when the join columns are not indexed properly.
Slow joins may indicate:
- Missing indexes on relationship columns.
- Poor data model design.
- Joining too many rows before filtering.
- Complex reporting queries running on transactional tables.
- Application screens asking for too much related data at once.
Sorting
Sorting can become expensive when PostgreSQL must order a large number of rows. Sorting is common in admin lists, search results, reports, article pages, product pages, and activity feeds.
Sorting becomes more problematic when the query also filters, joins, or paginates large datasets.
Filtering
Filtering is efficient when PostgreSQL can quickly narrow the result. It becomes slow when PostgreSQL has to read many rows and discard most of them.
A strong performance habit is to ask: “Can PostgreSQL find the rows directly, or is it reading too much and filtering afterward?”
Common Causes of Slow PostgreSQL Queries
Slow PostgreSQL queries usually come from repeated patterns. Understanding these patterns helps developers diagnose problems faster.
Filtering on Unindexed Columns
One of the most common causes is filtering a large table by a column that has no useful index.
This often happens with columns such as:
- Status
- Username
- Slug
- Date
- Category
- Foreign key
- Tenant or organization ID
- Published state
- Payment status
If the query is frequent and the table is large, filtering without the right index can become expensive.
Large Joins Without Proper Planning
Joins are powerful, but they can become slow when large tables are connected without good filtering or indexing.
A common problem is joining several tables first and filtering later. The database may process many unnecessary rows before reaching the final result.
Good design usually filters early and joins only the necessary data.
Pagination on Large Tables
Pagination seems simple, but it can become slow on large datasets. Traditional pagination can force the database to skip many rows before returning the current page. The deeper the page, the more expensive it can become.
This affects:
- Admin panels.
- Blog archives.
- Product catalogs.
- Logs.
- User lists.
- Transaction histories.
- Search results.
Large-scale pagination requires careful design, especially when combined with sorting and filtering.
Expensive Sorting
Sorting by date, name, popularity, score, or activity can be expensive when the dataset is large. Sorting becomes even more costly when PostgreSQL must sort after joining or filtering many rows.
A useful index can sometimes support sorting, but only when it matches the query pattern.
N+1 Query Patterns
An N+1 query pattern happens when an application loads one main list and then runs additional queries for each item in that list.
For example, a page may load 50 articles, then separately load the author, category, comments, and tags for each article. The user sees one page, but the database receives many queries.
This is usually an application design problem rather than a PostgreSQL problem.
Dashboard Queries Running Too Often
Dashboards often calculate counts, totals, trends, and summaries. If every page visit recalculates everything from raw data, PostgreSQL can become overloaded.
Dashboards should be designed carefully. Some metrics can be cached, precomputed, limited by date range, or moved to reporting workflows.
Searching Without Search Design
Text search, partial matching, and broad filters can become slow if implemented without a proper search strategy.
Search features need careful decisions:
- What fields are searchable?
- How large is the dataset?
- Does the search need exact match, prefix match, or full-text search?
- Should results be ranked?
- Should search be handled inside PostgreSQL or by a dedicated search engine?
- Should old or inactive records be excluded?
A search box can become one of the most expensive features in an application.
Application-Level Problems That Affect PostgreSQL
PostgreSQL performance is not only a database issue. Backend code, ORM usage, page design, and business logic strongly affect database load.
Loading More Data Than Needed
A page rarely needs every column from every related object. Loading unnecessary data increases memory use, network transfer, and database work.
Applications should be designed around the data needed for the current screen or workflow.
Repeating Queries Unnecessarily
Repeated database calls are common in web applications. A backend may ask the database the same question multiple times during one request.
This can happen with permissions, user profiles, navigation menus, notification counts, categories, tags, settings, or dashboard metrics.
Reducing repeated queries often improves performance more than upgrading hardware.
Heavy Admin Pages
Admin interfaces often become slow because they list large datasets, show too many columns, load relationships, and allow broad filters.
A production admin panel should be treated as a real application interface. It needs filters, limits, optimized relationships, and careful search behavior.
Real-Time Calculations for Everything
Some values do not need to be calculated in real time. Counts, summaries, popularity scores, analytics, and reports can often be cached or prepared in advance.
Real-time calculation is useful when freshness is essential. But for many features, slightly delayed data is acceptable and much cheaper.
Poor Background Job Design
Background tasks can overload PostgreSQL if they process too much data at once, run during peak traffic, or compete with user-facing requests.
Background jobs should be scheduled, limited, monitored, and designed to avoid unnecessary pressure on production tables.
PostgreSQL Monitoring Signals Developers Should Understand
Monitoring helps you know whether a performance problem is caused by queries, infrastructure, traffic, locks, or application behavior.
You do not need advanced database expertise to understand the most important signals.
Slow Query Frequency
One slow query is not always a crisis. A query that is slow thousands of times per day is more serious.
Frequency matters because a moderately slow query can become expensive when repeated often.
Average Time Versus Worst Time
Average query time can hide outliers. A query may usually be fast but occasionally take several seconds. Worst-case performance matters for user experience and reliability.
Look for both regular slowness and sudden spikes.
Rows Read Versus Rows Returned
A query that reads millions of rows to return ten results is often inefficient.
This is one of the clearest signs that filtering, indexing, or query design needs improvement.
Lock Waiting
Sometimes a query is slow because it is waiting, not because it is computationally expensive.
Lock-related problems can happen during updates, migrations, imports, long transactions, or maintenance operations.
Connection Pressure
Too many open database connections can reduce performance. Web applications should manage connections carefully, especially under traffic spikes.
Connection pooling can help, but it must be configured thoughtfully. More connections are not always better.
Disk I/O
When PostgreSQL cannot serve enough data from memory, it may need to read heavily from disk. Slow disk activity can make queries much slower.
Disk I/O pressure is especially important for large tables, reporting queries, and workloads that exceed memory capacity.
Indexing Strategy for Real Applications
A good PostgreSQL indexing strategy starts with real user behavior and real query patterns. The goal is not to create many indexes. The goal is to create the right indexes.
Start With Frequent and Important Queries
Prioritize queries that are:
- Used on important user-facing pages.
- Repeated frequently.
- Slow under normal conditions.
- Connected to revenue, registration, search, checkout, publishing, or administration.
- Expensive during traffic peaks.
Optimizing rarely used queries may be less urgent than fixing a slightly slow query used on every page.
Index Columns Used for Filtering
Columns used in frequent filters are strong index candidates, especially when the table is large and the filter returns a small subset of rows.
Examples include status, date, account ID, organization ID, category ID, user ID, published state, and unique identifiers.
Index Relationship Columns
Foreign key relationships are often involved in joins. If related data is frequently loaded, filtered, or counted, relationship columns need attention.
Good relationship indexing can dramatically improve common backend pages.
Consider Combined Query Patterns
Some queries filter by more than one column. In these cases, a combined index may be more useful than separate indexes.
However, column order matters. The best design depends on the most common filter and sort patterns.
Review Unused Indexes
Unused indexes consume storage and slow writes without providing benefits. A mature application should periodically review whether indexes are still useful.
As features change, some indexes become unnecessary.
Avoid Indexing Every Column
Indexing every column is a common beginner mistake. It increases complexity and write overhead.
Indexes should be intentional, measured, and connected to real queries.
When Caching Helps and When It Does Not
Caching can reduce PostgreSQL load, but it should not be used to hide broken query design. Caching is most useful when the same result is requested often and does not need to change every second.
When Caching Helps
Caching can help with:
- Navigation menus.
- Category lists.
- Popular articles.
- Public statistics.
- Dashboard summaries.
- User permissions.
- Frequently requested configuration.
- Expensive but stable calculations.
- Read-heavy pages.
Caching reduces repeated database work and improves response time.
When Caching Does Not Solve the Real Problem
Caching may not help when:
- Every request is unique.
- Data changes constantly.
- The slow query is used for internal maintenance.
- The database is slow because of locks.
- Writes are the bottleneck.
- The query must always return fresh data.
- The application has poor data modeling.
Caching should be part of a performance strategy, not a substitute for database understanding.
Cache Invalidation Matters
Caching introduces a new question: when should cached data be refreshed?
Poor cache invalidation can show outdated or incorrect data. Teams should decide which data can be slightly delayed and which data must always be accurate.
When Should You Actually Scale PostgreSQL?
You should consider scaling PostgreSQL when query optimization, indexing, application improvements, caching, and monitoring show that the workload genuinely exceeds the current infrastructure.
Scaling is valid, but it should be evidence-based.
Signs Scaling May Be Necessary
Scaling becomes reasonable when:
- Important queries are already optimized.
- Indexes are appropriate.
- Application query behavior is efficient.
- Caching is used where appropriate.
- CPU, memory, or disk I/O is consistently saturated.
- Traffic growth is legitimate and sustained.
- The database handles more concurrent users than before.
- Business requirements demand faster response times.
At this point, hardware or architecture scaling may be the correct next step.
Vertical Scaling
Vertical scaling means using a larger server or database instance with more CPU, memory, faster storage, or better I/O capacity.
It is often the simplest scaling option. It can be effective when the application has outgrown the current machine.
However, vertical scaling has limits and can become expensive.
Read Replicas
Read replicas can help when read traffic is much heavier than write traffic. They allow some read queries to be served by replica databases instead of the primary database.
Read replicas are useful for:
- Reporting.
- Analytics.
- Read-heavy dashboards.
- Public content delivery.
- Large internal admin queries.
- Search or browsing pages that do not require immediate consistency.
However, replicas introduce complexity. Data may not be perfectly current at every moment, and application routing becomes more important.
Partitioning
Partitioning divides large tables into smaller logical pieces. It can help when data has a natural separation, such as date ranges, tenants, regions, or archive periods.
Partitioning is not a beginner fix for every slow query. It works best when the access pattern clearly benefits from dividing data.
Archiving Old Data
Many applications keep old data in active tables even when users rarely need it. Archiving old records can reduce table size, improve query performance, and simplify backups.
This is useful for logs, historical transactions, old notifications, audit trails, and expired records.
Dedicated Search or Analytics Systems
PostgreSQL is powerful, but not every workload should stay in the main transactional database.
For large search, analytics, logs, or event processing, a separate system may be more appropriate. The key is to avoid overloading the primary database with workloads it was not designed to handle.
PostgreSQL Performance Tuning Checklist
Use this checklist before deciding to scale hardware.
Query-Level Checklist
| Question | Why It Matters |
|---|---|
| Is the query used frequently? | Frequent slow queries have a bigger impact |
| Does it scan too many rows? | Reading unnecessary rows wastes resources |
| Does it return more data than needed? | Large result sets slow the database and application |
| Does it filter on indexed columns? | Missing indexes are a common cause of slowness |
| Does it sort a large dataset? | Sorting can become expensive at scale |
| Does it join large tables? | Joins need careful indexing and filtering |
| Does performance degrade with table growth? | Growth-related slowness requires structural fixes |
Application-Level Checklist
| Question | Why It Matters |
|---|---|
| Is the page making too many database requests? | Many small queries can be worse than one optimized query |
| Is there an N+1 query pattern? | Repeated relationship loading can overload PostgreSQL |
| Are dashboards recalculating too much? | Real-time summaries can become expensive |
| Are admin pages loading too much data? | Admin interfaces often become hidden performance problems |
| Are repeated values cached? | Stable repeated data should not always hit the database |
Database-Level Checklist
| Question | Why It Matters |
|---|---|
| Are indexes aligned with real queries? | Indexes should support actual access patterns |
| Are there unused indexes? | Unused indexes add overhead |
| Are table statistics current? | PostgreSQL needs accurate data distribution estimates |
| Are there long-running transactions? | They can cause locking and maintenance issues |
| Are important tables growing too quickly? | Growth may require archiving or partitioning |
Infrastructure-Level Checklist
| Question | Why It Matters |
|---|---|
| Is CPU consistently high? | CPU pressure may indicate heavy query processing |
| Is memory insufficient? | Poor memory behavior can increase disk reads |
| Is disk I/O saturated? | Slow storage can severely affect performance |
| Are there too many connections? | Connection pressure can reduce stability |
| Are traffic spikes predictable? | Predictable load can be managed with planning |
Common Mistakes to Avoid
Mistake 1: Scaling Hardware Before Understanding the Query
Upgrading hardware may make the problem disappear temporarily, but it does not teach the team why the query was slow. Without diagnosis, the same issue may return later at a higher cost.
Mistake 2: Adding Indexes Randomly
Indexes should be based on real query patterns. Random indexing can increase storage, slow writes, and create maintenance overhead.
Mistake 3: Ignoring Application Query Behavior
Developers sometimes focus only on PostgreSQL while ignoring the backend code. If the application sends hundreds of unnecessary queries per request, the database will suffer.
Mistake 4: Testing Only With Small Development Data
Small datasets hide performance problems. A feature that works perfectly during development may fail in production because the real table size is much larger.
Mistake 5: Treating Admin Pages as Unimportant
Admin pages are often used by staff, editors, support teams, or business users. If they are slow, they reduce productivity and may create database load during working hours.
Mistake 6: Optimizing Rare Queries First
Not every slow query has the same importance. A query that runs once per month may matter less than a query that runs on every page load.
Mistake 7: Ignoring Locks
A query can be slow because it is waiting for another operation. If you only look at query structure, you may miss transaction and locking problems.
Mistake 8: Forgetting Cloud Cost
Database scaling can become expensive. Optimizing before scaling helps reduce cloud bills and improves long-term sustainability.
Security and Reliability Considerations
Performance tuning is not only about speed. It also affects reliability and security.
Slow Queries Can Become Availability Risks
A slow query used frequently can overload the database. Under high traffic, this can reduce availability for the entire application.
One poorly designed endpoint can create heavy database pressure and affect all users.
Broad Search and Filtering Can Be Abused
Search pages, filters, exports, and reports can be expensive. If public users can trigger heavy database operations, attackers or bots may abuse them.
Applications should limit expensive queries, apply sensible filters, and protect resource-heavy endpoints.
Admin Tools Need Protection
Internal tools can also overload PostgreSQL. Admin exports, bulk actions, reports, and dashboards should be designed with limits and monitoring.
Performance Problems Can Hide Data Integrity Issues
Long-running operations, failed jobs, and timeout-prone processes can lead to incomplete workflows. Reliable database performance supports reliable business operations.
Performance Considerations for Production Teams
Design for Growth Early
You do not need enterprise-level architecture from day one, but you should think about growth. Ask what will happen when the table becomes 10 times larger or traffic doubles.
Monitor Before There Is a Problem
Performance monitoring should not start after users complain. Teams should track slow queries, connection usage, resource pressure, and application response time before incidents happen.
Separate User-Facing and Heavy Internal Workloads
User-facing requests should stay fast. Heavy reports, imports, exports, and maintenance tasks should be designed carefully so they do not harm normal users.
Use Performance Budgets
A performance budget defines acceptable response times for important pages and workflows. If a page exceeds the budget, the team investigates before the problem becomes normal.
Review Database Performance During Feature Development
Performance should be part of feature review. Developers should ask:
- What data does this feature load?
- How often will it run?
- Will it grow with users?
- Does it need indexes?
- Does it create repeated queries?
- Can it be cached?
- Could it overload the database later?
Troubleshooting Slow PostgreSQL Queries
When a PostgreSQL query is slow, follow a structured process instead of guessing.
Step 1: Identify the Slowest and Most Frequent Queries
Start with the queries that affect users most. A slow query used on the homepage, login flow, dashboard, checkout, article page, or admin list deserves priority.
Step 2: Understand the Business Context
Ask what the query is trying to achieve. Sometimes the best fix is not technical tuning but changing the product behavior.
For example, a dashboard may not need all-time statistics refreshed on every page load. A search page may not need to search inactive records. An admin list may not need to show every relationship by default.
Step 3: Check Table Size and Data Distribution
A query’s performance depends on data volume and distribution. A column with only two possible values behaves differently from a column with millions of distinct values.
Understanding the shape of the data helps explain why PostgreSQL chooses certain strategies.
Step 4: Review Index Fit
Check whether the existing indexes match the way the query filters, joins, and sorts data.
The key question is not “Does this table have indexes?” The better question is “Does this query have the right index support?”
Step 5: Look for Application-Level Repetition
A single slow query is one problem. A page that sends many queries is another.
Review whether the backend repeats database calls, loads unnecessary relationships, or recalculates values too often.
Step 6: Check Resource Pressure
If query design looks reasonable, examine CPU, memory, disk, and connection pressure. Infrastructure scaling becomes more relevant when resources are consistently saturated.
Step 7: Choose the Smallest Effective Fix
The best fix is usually the smallest change that solves the real problem. That may be an index, a query redesign, a cache, a background job, a pagination change, an archive strategy, or hardware scaling.
Avoid large architecture changes before proving they are necessary.
Comparison: Optimization Before Scaling Versus Scaling First
| Approach | Advantages | Disadvantages | Best For |
|---|---|---|---|
| Optimize before scaling | Lower cost, better understanding, long-term performance, cleaner architecture | Requires analysis and monitoring | Most slow query problems |
| Scale hardware first | Fast temporary relief, simple cloud action | Can be expensive, may hide root cause | Confirmed infrastructure limits |
| Add caching | Reduces repeated load, improves response time | Requires invalidation strategy | Stable repeated data |
| Add indexes | Can dramatically improve reads | Can slow writes if overused | Frequent selective queries |
| Add read replicas | Helps read-heavy workloads | Adds complexity and consistency considerations | Large read traffic |
| Partition/archive data | Improves large-table management | Requires careful planning | Very large historical datasets |
Practical Decision Framework
Use this framework before scaling PostgreSQL.
If One Query Is Slow
Focus on that query’s filter, join, sort, index support, and result size.
If Many Queries Are Slow
Check infrastructure resources, connection usage, table growth, and application-wide access patterns.
If Slowness Appears During Traffic Peaks
Check concurrency, connection pooling, caching, repeated queries, and server resources.
If Admin Pages Are Slow
Limit data loading, improve filtering, review relationship loading, and avoid broad searches on large tables.
If Reports Are Slow
Move heavy reporting away from user-facing request paths, consider caching, summaries, read replicas, or analytics systems.
If Writes Are Slow
Review index count, transaction size, background jobs, locking, and write-heavy workflows.
If Costs Are Increasing
Prioritize query optimization, caching, archiving, and monitoring before moving to a more expensive database tier.
Best Practices for Keeping PostgreSQL Fast
Build Features With Data Growth in Mind
Every feature should be designed with realistic data growth. Think about what happens when the table has millions of rows, not only hundreds.
Make Query Performance Part of Code Review
Performance should be reviewed before deployment. Teams should discuss database access patterns, indexes, repeated queries, and expensive pages.
Keep User-Facing Requests Lightweight
Heavy work should not happen during normal user requests unless absolutely necessary. Users should not wait for expensive database calculations that could be cached or processed separately.
Use Indexes Intentionally
Create indexes for real access patterns. Review them periodically. Remove indexes that no longer provide value.
Monitor Continuously
Without monitoring, performance tuning becomes guesswork. Track slow queries, response times, connection usage, and resource pressure.
Avoid Unlimited Queries
Search, filters, exports, reports, and admin pages need limits. Unlimited access to large datasets can create serious performance and security problems.
Plan for Maintenance
Databases need maintenance, statistics, backups, monitoring, and review. PostgreSQL is powerful, but it should not be ignored after deployment.
FAQ: Slow PostgreSQL Queries
1. Why is my PostgreSQL query slow?
A PostgreSQL query is usually slow because it reads too many rows, lacks a useful index, performs expensive joins, sorts large datasets, waits for locks, or is called too often by the application. Hardware can be the cause, but query design and application behavior should be checked first.
2. Should I upgrade my database server to fix slow queries?
Not immediately. You should first check indexes, query patterns, table size, application behavior, connection usage, and resource pressure. Upgrading hardware is useful when the workload is already optimized and the server is genuinely saturated.
3. Do indexes always make PostgreSQL faster?
No. Indexes help specific read patterns, but they also add storage and write overhead. An index only improves performance when it matches the way the query filters, joins, or sorts data.
4. Can too many indexes slow down PostgreSQL?
Yes. Too many indexes can slow down inserts, updates, deletes, imports, and maintenance operations. Indexes should be created intentionally based on real query needs.
5. Why is PostgreSQL slow even after adding an index?
PostgreSQL may not use the index if the query returns many rows, the index does not match the query pattern, the column has low selectivity, the statistics are outdated, or sorting and joining still require expensive work.
6. Does more RAM make PostgreSQL faster?
More RAM can help when memory pressure is causing excessive disk reads. However, RAM will not fix inefficient query patterns, missing indexes, bad joins, N+1 queries, or poor application design.
7. What is the most common cause of slow PostgreSQL performance in web applications?
Common causes include missing indexes, N+1 query patterns, large table scans, inefficient pagination, expensive dashboards, heavy admin pages, and queries that were designed using small development data but fail with production data.
8. When should I use caching for PostgreSQL performance?
Use caching when the same data is requested often and does not need to be perfectly fresh every second. Caching is useful for menus, settings, summaries, popular content, and dashboards. It should not replace proper indexing or query design.
9. When should I use read replicas?
Read replicas are useful when your application has heavy read traffic that can be separated from writes. They are often useful for reporting, analytics, dashboards, and public read-heavy pages. They add complexity and should be introduced after optimization.
10. Is PostgreSQL good for large applications?
Yes. PostgreSQL can support large and serious applications when designed, indexed, monitored, and scaled properly. Performance problems often come from poor access patterns rather than PostgreSQL itself.
11. How do I know if a slow query is caused by locks?
A lock-related problem usually appears when a query spends time waiting rather than actively processing. This can happen during updates, migrations, long transactions, imports, or competing operations on the same data.
12. What should developers learn first about PostgreSQL performance?
Developers should first understand indexes, query plans at a basic level, table growth, joins, pagination, N+1 query patterns, caching, and monitoring. These concepts solve many real-world PostgreSQL performance problems.
Conclusion
Slow PostgreSQL queries should not automatically lead to hardware scaling. In many cases, the real issue is not the size of the server but the amount of unnecessary work the database is being asked to perform.
Before upgrading hardware, developers should check query behavior, indexes, joins, sorting, pagination, table growth, application query patterns, monitoring signals, and infrastructure resource usage. This approach reduces cost, improves reliability, and creates a stronger foundation for future growth.
Scaling is still important, but it should come after diagnosis. A well-optimized PostgreSQL database can handle much more than many teams expect. The best performance strategy combines good database design, intentional indexing, careful application development, monitoring, caching, and evidence-based scaling.
For MofidTech readers, the key takeaway is clear: optimize first, scale with evidence, and treat database performance as an engineering discipline rather than an emergency reaction.








💬 Comments
No comments yet. Be the first to comment!
Login to comment.