Part 1. The Ultimate Guide
1. Introduction: What is a Digital Twin?
A digital twin is a virtual replica of a physical object, system, or process that continuously receives real-time data from its real-world counterpart. This digital representation is not static—it evolves, learns, and adapts as data flows into it, enabling simulation, analysis, and optimization.
The concept gained massive traction with companies like General Electric and Siemens, who used digital twins to monitor turbines, predict failures, and optimize performance.
At its core, a digital twin bridges the gap between the physical world and the digital world, forming a key pillar of modern technologies such as Industry 4.0, IoT, and smart systems.
A digital twin system is composed of several interconnected layers:
a. Physical Entity
The real-world object—this could be anything from a machine, a building, or even a human body.
b. Sensors and IoT Devices
These collect real-time data such as temperature, pressure, speed, or usage metrics.
c. Data Transmission Layer
Data is transmitted via networks (Wi-Fi, 5G, or industrial protocols) to processing systems.
d. Digital Model
A virtual model that mirrors the physical entity using simulation tools and data analytics.
e. Analytics & AI Engine
This layer uses machine learning algorithms to extract insights, predict failures, and recommend actions.
f. Visualization Interface
Dashboards and 3D interfaces allow engineers to interact with the twin in real time.
3. Evolution of Digital Twins
The idea of digital twins originated from NASA during the Apollo 13 mission. Engineers created physical replicas and simulations to diagnose problems remotely.
Over time, the concept evolved:
- 2000s: Simulation models in engineering
- 2010s: Integration with IoT and cloud computing
- 2020s: AI-driven predictive and autonomous systems
Today, digital twins are dynamic, intelligent, and deeply integrated with real-time data streams.
4. Types of Digital Twins
1. Component Twins
Represent individual parts (e.g., a motor or sensor).
2. Asset Twins
Model complete assets (e.g., an engine or machine).
3. System Twins
Simulate entire systems (e.g., a production line).
4. Process Twins
Represent workflows or business processes.
Each level increases in complexity and provides broader insights.
5. Key Technologies Behind Digital Twins
Digital twins rely on a powerful ecosystem of technologies:
a. Internet of Things (IoT)
IoT devices capture real-time data from physical systems.
b. Artificial Intelligence (AI)
AI models analyze patterns, predict failures, and optimize operations.
c. Cloud Computing
Platforms like Microsoft Azure and Amazon Web Services provide scalable infrastructure for data storage and processing.
d. Edge Computing
Processes data closer to the source, reducing latency.
e. Big Data Analytics
Handles massive volumes of structured and unstructured data.
6. How Digital Twins Work (Step-by-Step)
- Sensors collect data from the physical object
- Data is transmitted to cloud or edge systems
- The digital model updates in real time
- AI analyzes the data and detects anomalies
- Insights are visualized for users
- Actions are taken to optimize performance
This continuous loop creates a feedback system that improves efficiency over time.
7. Real-World Applications
a. Manufacturing
Factories use digital twins to monitor machines, reduce downtime, and improve productivity. Predictive maintenance allows companies to fix issues before failures occur.
b. Healthcare
Digital twins are used to simulate human organs and predict disease progression. This opens the door to personalized medicine.
c. Smart Cities
Cities use digital twins to manage traffic, energy consumption, and infrastructure planning.
d. Energy Sector
Wind turbines and power plants are monitored using digital twins to optimize performance and reduce energy waste.
e. Automotive & Aerospace
Companies simulate vehicles and aircraft to test performance under different conditions without physical prototypes.
8. Benefits of Digital Twins
1. Predictive Maintenance
Identify failures before they happen.
2. Cost Reduction
Reduce operational and maintenance costs.
3. Improved Performance
Optimize systems in real time.
4. Better Decision-Making
Data-driven insights improve strategic planning.
5. Innovation Acceleration
Test new ideas in a virtual environment.
9. Challenges and Limitations
Despite its advantages, digital twin technology faces several challenges:
- High initial cost
- Data security and privacy concerns
- Integration complexity
- Data quality issues
- Scalability limitations
Organizations must carefully plan implementation to overcome these barriers.
10. Digital Twin vs Simulation
| Feature | Simulation | Digital Twin |
|---|---|---|
| Data | Static | Real-time |
| Interaction | Limited | Continuous |
| Intelligence | Basic | AI-driven |
| Purpose | Testing | Monitoring + Optimization |
A digital twin is essentially an advanced, real-time simulation.
11. Role in Industry 4.0
Digital twins are a cornerstone of Industry 4.0, enabling:
- Smart factories
- Autonomous systems
- Real-time optimization
- Human-machine collaboration
They transform traditional industries into intelligent ecosystems.
12. Future of Digital Twins
The future of digital twins is incredibly promising:
- Integration with metaverse environments
- AI-driven autonomous decision-making
- Expansion into personal digital twins
- Real-time global system simulations
Companies like NVIDIA are already building simulation platforms for large-scale digital twin environments.
13. Digital Twins in IoT Ecosystems
In IoT ecosystems, digital twins act as the central intelligence layer. They transform raw sensor data into meaningful insights and actionable decisions.
This synergy enhances:
- Automation
- Predictive analytics
- System resilience
14. Security Considerations
Security is critical because digital twins rely on continuous data exchange:
- Encrypt data transmission
- Secure APIs
- Implement identity management
- Monitor anomalies
A compromised digital twin can lead to serious operational risks.
15. Implementation Strategy
To successfully implement a digital twin:
- Define clear objectives
- Select the right platform
- Integrate IoT sensors
- Build accurate models
- Deploy analytics tools
- Continuously monitor and improve
16. Digital Twin Platforms
Popular platforms include:
- IBM Digital Twin solutions
- PTC ThingWorx
- Dassault Systèmes 3DEXPERIENCE
These platforms provide tools for modeling, simulation, and analytics.
17. Case Study Example
A manufacturing company implemented a digital twin for its production line:
- Reduced downtime by 30%
- Improved efficiency by 20%
- Saved millions in maintenance costs
This demonstrates the real business value of digital twins.
18. Digital Twin and AI Integration
AI enhances digital twins by enabling:
- Predictive analytics
- Anomaly detection
- Autonomous optimization
This combination creates self-learning systems.
19. Ethical Considerations
As digital twins evolve, ethical concerns arise:
- Data ownership
- Privacy issues
- Bias in AI models
Organizations must ensure responsible use of this technology.
20. Conclusion
Digital twins represent a revolutionary shift in how we interact with the physical world. By combining IoT, AI, and real-time data, they enable smarter decisions, improved efficiency, and continuous innovation.
As industries continue to digitize, digital twins will become an essential tool for businesses seeking to stay competitive in a rapidly evolving technological landscape.
Part 2. Real Django Project: Digital Twin Dashboard
1. Project Idea
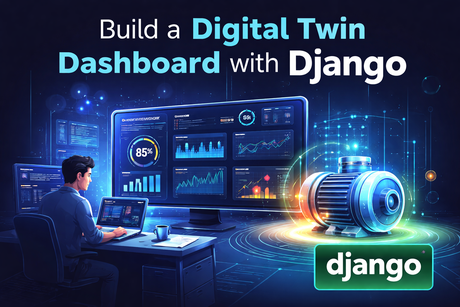
This project is a Digital Twin Monitoring Dashboard built with Django. The goal is to represent a real machine, device, or industrial asset inside a web dashboard. The physical asset sends telemetry data such as temperature, vibration, pressure, power usage, and operating status. Django stores that data, displays it in charts and cards, detects anomalies, and simulates the current health of the asset.
In simple words, the project creates a virtual live copy of a real machine. That virtual copy is the digital twin. Instead of only seeing raw values, the user sees an interpreted model: current state, health score, alerts, maintenance risk, and performance trends. This makes the project much more interesting than a basic CRUD app because it connects software engineering, data visualization, monitoring, and prediction in one system.
This kind of project fits perfectly on a platform like MofidTech because it demonstrates many useful Django concepts at once: models, relationships, dashboards, charts, APIs, background updates, validations, business logic, and clean UI. It also feels modern and professional, especially if you present it as a smart-industry or IoT-inspired application.
2. What the Dashboard Will Do
Our digital twin dashboard will include these real features:
- register physical assets
- define sensors for each asset
- store telemetry values over time
- show current machine status
- calculate a health score
- detect warning and critical states
- display charts for recent data
- simulate future maintenance risk
- show active alerts
- provide a small API endpoint for incoming sensor data
A real-world example would be a factory motor. The motor has temperature, vibration, RPM, and voltage sensors. The Django dashboard receives this data and mirrors the machine’s condition in real time. If the vibration becomes too high, the dashboard shows a warning. If temperature rises too much, the system changes the twin state to critical and can suggest maintenance.
3. Project Structure
Here is a clean Django project structure:
digital_twin_project/
│
├── manage.py
├── digital_twin_project/
│   ├── __init__.py
│   ├── settings.py
│   ├── urls.py
│   ├── asgi.py
│   └── wsgi.py
│
├── twin_dashboard/
│   ├── migrations/
│   ├── templates/
│   │   └── twin_dashboard/
│   │       ├── base.html
│   │       ├── dashboard.html
│   │       ├── asset_list.html
│   │       ├── asset_detail.html
│   │       ├── alerts.html
│   │       └── simulator.html
│   ├── static/
│   │   └── twin_dashboard/
│   │       ├── css/
│   │       │   └── style.css
│   │       └── js/
│   │           └── charts.js
│   ├── admin.py
│   ├── apps.py
│   ├── forms.py
│   ├── models.py
│   ├── urls.py
│   ├── views.py
│   ├── utils.py
│   └── api_views.py
This structure is realistic and scalable. It separates templates, static files, business logic, and API logic. That matters because a digital twin project can grow quickly.
4. Create the Project
Start with:
django-admin startproject digital_twin_project
cd digital_twin_project
python manage.py startapp twin_dashboard
Add the app to INSTALLED_APPS:
# settings.py
INSTALLED_APPS = [
    "django.contrib.admin",
    "django.contrib.auth",
    "django.contrib.contenttypes",
    "django.contrib.sessions",
    "django.contrib.messages",
    "django.contrib.staticfiles",
    "twin_dashboard",
]
Set templates and static files normally.
5. Database Models
Now let us design the data model. This is the heart of the project.
# twin_dashboard/models.py
from django.db import models
from django.utils import timezone


class Asset(models.Model):
    STATUS_CHOICES = [
        ("normal", "Normal"),
        ("warning", "Warning"),
        ("critical", "Critical"),
        ("offline", "Offline"),
    ]

    name = models.CharField(max_length=150)
    asset_code = models.CharField(max_length=50, unique=True)
    location = models.CharField(max_length=150, blank=True)
    description = models.TextField(blank=True)
    status = models.CharField(max_length=20, choices=STATUS_CHOICES, default="normal")
    health_score = models.FloatField(default=100.0)
    last_seen = models.DateTimeField(null=True, blank=True)
    created_at = models.DateTimeField(auto_now_add=True)

    def __str__(self):
        return f"{self.name} ({self.asset_code})"


class Sensor(models.Model):
    SENSOR_TYPES = [
        ("temperature", "Temperature"),
        ("vibration", "Vibration"),
        ("pressure", "Pressure"),
        ("rpm", "RPM"),
        ("voltage", "Voltage"),
        ("current", "Current"),
    ]

    asset = models.ForeignKey(Asset, on_delete=models.CASCADE, related_name="sensors")
    name = models.CharField(max_length=100)
    sensor_type = models.CharField(max_length=50, choices=SENSOR_TYPES)
    unit = models.CharField(max_length=20, default="")
    min_threshold = models.FloatField(default=0)
    max_threshold = models.FloatField(default=100)
    is_active = models.BooleanField(default=True)

    def __str__(self):
        return f"{self.asset.name} - {self.name}"


class TelemetryData(models.Model):
    asset = models.ForeignKey(Asset, on_delete=models.CASCADE, related_name="telemetry")
    sensor = models.ForeignKey(Sensor, on_delete=models.CASCADE, related_name="readings")
    value = models.FloatField()
    recorded_at = models.DateTimeField(default=timezone.now)

    class Meta:
        ordering = ["-recorded_at"]

    def __str__(self):
        return f"{self.asset.name} - {self.sensor.name} - {self.value}"


class Alert(models.Model):
    LEVEL_CHOICES = [
        ("info", "Info"),
        ("warning", "Warning"),
        ("critical", "Critical"),
    ]

    asset = models.ForeignKey(Asset, on_delete=models.CASCADE, related_name="alerts")
    sensor = models.ForeignKey(Sensor, on_delete=models.SET_NULL, null=True, blank=True)
    level = models.CharField(max_length=20, choices=LEVEL_CHOICES)
    message = models.CharField(max_length=255)
    is_active = models.BooleanField(default=True)
    created_at = models.DateTimeField(auto_now_add=True)

    def __str__(self):
        return f"{self.asset.name} - {self.level} - {self.message}"
Why these models matter
This model design is realistic because it reflects the true nature of a digital twin:
Assetrepresents the physical objectSensordefines what can be measuredTelemetryDatastores the time-series observationsAlertrecords abnormal or important events
This is much better than putting everything into one table. A digital twin is not just a machine name and one value. It is a structured system with multiple sensors, time-based readings, and dynamic state.
6. Register the Models in Admin
# twin_dashboard/admin.py
from django.contrib import admin
from .models import Asset, Sensor, TelemetryData, Alert

admin.site.register(Asset)
admin.site.register(Sensor)
admin.site.register(TelemetryData)
admin.site.register(Alert)
Create migrations:
python manage.py makemigrations
python manage.py migrate
python manage.py createsuperuser
7. Business Logic for the Digital Twin
A digital twin should not only store values. It should interpret them. Let us create logic to calculate health and create alerts.
# twin_dashboard/utils.py
from django.utils import timezone
from .models import Alert


def evaluate_asset_health(asset):
    sensors = asset.sensors.filter(is_active=True)
    total_score = 100
    active_alerts = []

    for sensor in sensors:
        latest = sensor.readings.order_by("-recorded_at").first()
        if not latest:
            continue

        value = latest.value
        if value < sensor.min_threshold or value > sensor.max_threshold:
            total_score -= 20
            active_alerts.append(
                {
                    "sensor": sensor,
                    "level": "critical" if abs(value - sensor.max_threshold) > 10 else "warning",
                    "message": f"{sensor.name} reading out of range: {value}{sensor.unit}",
                }
            )

    total_score = max(0, total_score)

    if total_score >= 80:
        asset.status = "normal"
    elif total_score >= 50:
        asset.status = "warning"
    else:
        asset.status = "critical"

    asset.health_score = total_score
    asset.last_seen = timezone.now()
    asset.save()

    asset.alerts.filter(is_active=True).update(is_active=False)

    for item in active_alerts:
        Alert.objects.create(
            asset=asset,
            sensor=item["sensor"],
            level=item["level"],
            message=item["message"],
            is_active=True,
        )
Why this logic is important
This is where the project begins to feel like a real digital twin instead of a data logger. The twin interprets sensor values and converts them into meaning:
- Is the machine healthy?
- Is it drifting toward risk?
- Is maintenance needed?
- Should the dashboard warn the operator?
A digital twin is useful because it transforms measurement into decision support. That is exactly what evaluate_asset_health() starts to do.
8. Forms for Asset and Sensor Creation
# twin_dashboard/forms.py
from django import forms
from .models import Asset, Sensor


class AssetForm(forms.ModelForm):
    class Meta:
        model = Asset
        fields = ["name", "asset_code", "location", "description"]


class SensorForm(forms.ModelForm):
    class Meta:
        model = Sensor
        fields = [
            "asset",
            "name",
            "sensor_type",
            "unit",
            "min_threshold",
            "max_threshold",
            "is_active",
        ]
9. Dashboard Views
# twin_dashboard/views.py
from django.shortcuts import render, get_object_or_404, redirect
from django.db.models import Count
from .models import Asset, Sensor, TelemetryData, Alert
from .forms import AssetForm, SensorForm
from .utils import evaluate_asset_health


def dashboard(request):
    assets = Asset.objects.all()
    total_assets = assets.count()
    total_alerts = Alert.objects.filter(is_active=True).count()
    critical_assets = assets.filter(status="critical").count()
    warning_assets = assets.filter(status="warning").count()

    for asset in assets:
        evaluate_asset_health(asset)

    context = {
        "assets": assets,
        "total_assets": total_assets,
        "total_alerts": total_alerts,
        "critical_assets": critical_assets,
        "warning_assets": warning_assets,
    }
    return render(request, "twin_dashboard/dashboard.html", context)


def asset_list(request):
    assets = Asset.objects.all()
    return render(request, "twin_dashboard/asset_list.html", {"assets": assets})


def asset_detail(request, pk):
    asset = get_object_or_404(Asset, pk=pk)
    sensors = asset.sensors.all()
    telemetry = asset.telemetry.select_related("sensor")[:50]
    alerts = asset.alerts.filter(is_active=True)

    return render(request, "twin_dashboard/asset_detail.html", {
        "asset": asset,
        "sensors": sensors,
        "telemetry": telemetry,
        "alerts": alerts,
    })


def alerts_view(request):
    alerts = Alert.objects.filter(is_active=True).select_related("asset", "sensor")
    return render(request, "twin_dashboard/alerts.html", {"alerts": alerts})


def create_asset(request):
    if request.method == "POST":
        form = AssetForm(request.POST)
        if form.is_valid():
            form.save()
            return redirect("twin_dashboard:asset_list")
    else:
        form = AssetForm()
    return render(request, "twin_dashboard/simulator.html", {"form": form, "title": "Create Asset"})


def create_sensor(request):
    if request.method == "POST":
        form = SensorForm(request.POST)
        if form.is_valid():
            form.save()
            return redirect("twin_dashboard:dashboard")
    else:
        form = SensorForm()
    return render(request, "twin_dashboard/simulator.html", {"form": form, "title": "Create Sensor"})
10. API Endpoint for Sensor Data
This is where the project becomes truly interesting. Instead of entering everything manually, the dashboard accepts incoming data like a real monitoring platform.
# twin_dashboard/api_views.py
import json
from django.http import JsonResponse
from django.views.decorators.csrf import csrf_exempt
from .models import Asset, Sensor, TelemetryData
from .utils import evaluate_asset_health


@csrf_exempt
def ingest_telemetry(request):
    if request.method != "POST":
        return JsonResponse({"error": "Only POST allowed"}, status=405)

    try:
        data = json.loads(request.body)
        asset_code = data.get("asset_code")
        sensor_name = data.get("sensor_name")
        value = data.get("value")

        asset = Asset.objects.get(asset_code=asset_code)
        sensor = Sensor.objects.get(asset=asset, name=sensor_name)

        TelemetryData.objects.create(
            asset=asset,
            sensor=sensor,
            value=value
        )

        evaluate_asset_health(asset)

        return JsonResponse({
            "message": "Telemetry stored successfully",
            "asset": asset.name,
            "sensor": sensor.name,
            "value": value,
            "status": asset.status,
            "health_score": asset.health_score
        })

    except Asset.DoesNotExist:
        return JsonResponse({"error": "Asset not found"}, status=404)
    except Sensor.DoesNotExist:
        return JsonResponse({"error": "Sensor not found"}, status=404)
    except Exception as e:
        return JsonResponse({"error": str(e)}, status=400)
Why this endpoint matters
Without ingestion, your dashboard is just a static admin panel. With ingestion, it becomes a real digital twin platform. A sensor simulator, IoT device, Python script, or even Postman can send data into the system. The dashboard then reacts by updating health score and alerts.
This is the exact moment where the project becomes impressive for a portfolio, tutorial, or product demo.
11. URLs
# twin_dashboard/urls.py
from django.urls import path
from . import views, api_views

app_name = "twin_dashboard"

urlpatterns = [
    path("", views.dashboard, name="dashboard"),
    path("assets/", views.asset_list, name="asset_list"),
    path("assets/<int:pk>/", views.asset_detail, name="asset_detail"),
    path("alerts/", views.alerts_view, name="alerts"),
    path("assets/create/", views.create_asset, name="create_asset"),
    path("sensors/create/", views.create_sensor, name="create_sensor"),
    path("api/ingest/", api_views.ingest_telemetry, name="ingest_telemetry"),
]
And in the main project:
# digital_twin_project/urls.py
from django.contrib import admin
from django.urls import path, include

urlpatterns = [
    path("admin/", admin.site.urls),
    path("", include("twin_dashboard.urls")),
]
12. Base Template
<!-- templates/twin_dashboard/base.html -->
<!DOCTYPE html>
<html lang="en">
<head>
    <meta charset="UTF-8">
    <meta name="viewport" content="width=device-width, initial-scale=1.0">
    <title>{% block title %}Digital Twin Dashboard{% endblock %}</title>
    <script src="https://cdn.jsdelivr.net/npm/chart.js"></script>
    <style>
        body {
            font-family: Arial, sans-serif;
            background: #0f172a;
            color: #e2e8f0;
            margin: 0;
            padding: 0;
        }
        .container {
            width: 92%;
            max-width: 1200px;
            margin: 30px auto;
        }
        .card {
            background: #1e293b;
            padding: 20px;
            border-radius: 14px;
            margin-bottom: 20px;
            box-shadow: 0 8px 24px rgba(0,0,0,0.25);
        }
        .grid {
            display: grid;
            grid-template-columns: repeat(auto-fit, minmax(240px, 1fr));
            gap: 20px;
        }
        a {
            color: #38bdf8;
            text-decoration: none;
        }
        .status-normal { color: #22c55e; }
        .status-warning { color: #f59e0b; }
        .status-critical { color: #ef4444; }
        .btn {
            display: inline-block;
            background: #2563eb;
            color: white;
            padding: 10px 16px;
            border-radius: 10px;
        }
    </style>
</head>
<body>
    <div class="container">
        <h1>Digital Twin Dashboard</h1>
        <p>
            <a href="{% url 'twin_dashboard:dashboard' %}">Home</a> |
            <a href="{% url 'twin_dashboard:asset_list' %}">Assets</a> |
            <a href="{% url 'twin_dashboard:alerts' %}">Alerts</a> |
            <a href="{% url 'twin_dashboard:create_asset' %}">Add Asset</a> |
            <a href="{% url 'twin_dashboard:create_sensor' %}">Add Sensor</a>
        </p>

        {% block content %}{% endblock %}
    </div>
</body>
</html>
13. Main Dashboard Template
<!-- templates/twin_dashboard/dashboard.html -->
{% extends "twin_dashboard/base.html" %}

{% block title %}Dashboard{% endblock %}

{% block content %}
<div class="grid">
    <div class="card">
        <h3>Total Assets</h3>
        <p>{{ total_assets }}</p>
    </div>
    <div class="card">
        <h3>Active Alerts</h3>
        <p>{{ total_alerts }}</p>
    </div>
    <div class="card">
        <h3>Critical Assets</h3>
        <p>{{ critical_assets }}</p>
    </div>
    <div class="card">
        <h3>Warning Assets</h3>
        <p>{{ warning_assets }}</p>
    </div>
</div>

<div class="card">
    <h2>Assets Overview</h2>
    {% for asset in assets %}
        <div style="padding:12px 0; border-bottom:1px solid #334155;">
            <h3>
                <a href="{% url 'twin_dashboard:asset_detail' asset.pk %}">{{ asset.name }}</a>
            </h3>
            <p>Code: {{ asset.asset_code }}</p>
            <p>Status: <span class="status-{{ asset.status }}">{{ asset.status|title }}</span></p>
            <p>Health Score: {{ asset.health_score }}%</p>
            <p>Last Seen: {{ asset.last_seen }}</p>
        </div>
    {% empty %}
        <p>No assets available.</p>
    {% endfor %}
</div>
{% endblock %}
14. Asset Detail Page
<!-- templates/twin_dashboard/asset_detail.html -->
{% extends "twin_dashboard/base.html" %}

{% block title %}{{ asset.name }}{% endblock %}

{% block content %}
<div class="card">
    <h2>{{ asset.name }}</h2>
    <p><strong>Code:</strong> {{ asset.asset_code }}</p>
    <p><strong>Location:</strong> {{ asset.location }}</p>
    <p><strong>Status:</strong> <span class="status-{{ asset.status }}">{{ asset.status|title }}</span></p>
    <p><strong>Health Score:</strong> {{ asset.health_score }}%</p>
    <p><strong>Description:</strong> {{ asset.description }}</p>
</div>

<div class="card">
    <h3>Sensors</h3>
    {% for sensor in sensors %}
        <p>{{ sensor.name }} ({{ sensor.sensor_type }}) — Threshold: {{ sensor.min_threshold }} to {{ sensor.max_threshold }} {{ sensor.unit }}</p>
    {% empty %}
        <p>No sensors found.</p>
    {% endfor %}
</div>

<div class="card">
    <h3>Active Alerts</h3>
    {% for alert in alerts %}
        <p>[{{ alert.level|upper }}] {{ alert.message }}</p>
    {% empty %}
        <p>No active alerts.</p>
    {% endfor %}
</div>

<div class="card">
    <h3>Recent Telemetry</h3>
    <canvas id="telemetryChart"></canvas>
</div>

<script>
    const labels = [
        {% for item in telemetry reversed %}
            "{{ item.recorded_at|date:'H:i:s' }}",
        {% endfor %}
    ];

    const values = [
        {% for item in telemetry reversed %}
            {{ item.value }},
        {% endfor %}
    ];

    new Chart(document.getElementById('telemetryChart'), {
        type: 'line',
        data: {
            labels: labels,
            datasets: [{
                label: 'Telemetry Values',
                data: values,
                borderWidth: 2
            }]
        },
        options: {
            responsive: true
        }
    });
</script>
{% endblock %}
15. Alerts Page
<!-- templates/twin_dashboard/alerts.html -->
{% extends "twin_dashboard/base.html" %}

{% block title %}Alerts{% endblock %}

{% block content %}
<div class="card">
    <h2>Active Alerts</h2>
    {% for alert in alerts %}
        <div style="padding:10px 0; border-bottom:1px solid #334155;">
            <p><strong>{{ alert.asset.name }}</strong></p>
            <p>Sensor: {{ alert.sensor.name }}</p>
            <p>Level: {{ alert.level|title }}</p>
            <p>Message: {{ alert.message }}</p>
            <p>Created: {{ alert.created_at }}</p>
        </div>
    {% empty %}
        <p>No active alerts.</p>
    {% endfor %}
</div>
{% endblock %}
16. Simple Simulator Script
A digital twin project becomes more impressive when you can simulate incoming sensor values.
# simulator.py
import requests
import random
import time

URL = "http://127.0.0.1:8000/api/ingest/"

while True:
    payloads = [
        {"asset_code": "MOTOR-001", "sensor_name": "Motor Temp", "value": random.uniform(50, 110)},
        {"asset_code": "MOTOR-001", "sensor_name": "Motor Vibration", "value": random.uniform(1, 15)},
        {"asset_code": "MOTOR-001", "sensor_name": "Motor RPM", "value": random.uniform(800, 1800)},
    ]

    for payload in payloads:
        response = requests.post(URL, json=payload)
        print(response.json())

    time.sleep(5)
Why this simulator is useful
This script acts like a mini IoT device. It sends changing values every five seconds. That lets you watch the dashboard react live. Without real sensors, this is the perfect way to demonstrate a digital twin system during development, teaching, or product demos.
17. Sample Data to Create First
In admin, create:
Asset
- Name: Factory Motor 1
- Code: MOTOR-001
- Location: Production Room A
Sensors
- Motor Temp, type: temperature, unit: °C, min: 20, max: 90
- Motor Vibration, type: vibration, unit: mm/s, min: 0, max: 10
- Motor RPM, type: rpm, unit: rpm, min: 900, max: 1600
Then run the simulator. The dashboard will start showing normal, warning, and critical conditions depending on incoming values.
18. How This Becomes a True Digital Twin
Many people confuse a digital twin with a normal dashboard. They are related, but not identical. A normal dashboard displays data. A digital twin goes further:
- it mirrors a real object
- it updates continuously
- it interprets machine state
- it predicts issues
- it supports decision-making
This project starts with live mirroring and state interpretation. That is already a strong digital twin foundation. Later, you can make it even more advanced with forecasting, anomaly detection, or 3D visualization.
19. Advanced Improvements You Can Add Later
Here are realistic next steps:
Real-time updates with Django Channels
Instead of refreshing pages, push updates with WebSockets.
Predictive maintenance
Train a simple ML model using past temperature and vibration trends.
Health score weighting
Give some sensors more importance than others.
Asset comparison
Show multiple machines side by side.
Maintenance logs
Add a model to record technician interventions.
Historical analytics
Filter telemetry by hour, day, week, month.
Export reports
Generate PDF or CSV maintenance summaries.
API authentication
Protect ingestion using API keys or tokens.
Device offline detection
Mark an asset offline if no telemetry arrives for a certain period.
Role-based access
Operators can view, engineers can configure, admins can manage all.
20. Offline Detection Example
This makes the project more professional:
# in utils.py
from django.utils import timezone
from datetime import timedelta

def mark_offline_assets():
    threshold = timezone.now() - timedelta(minutes=2)
    for asset in Asset.objects.all():
        if asset.last_seen and asset.last_seen < threshold:
            asset.status = "offline"
            asset.save()
This is important because a silent machine is also meaningful. No data can mean loss of network, device failure, or shutdown.
21. Better Health Score Formula
The earlier formula is simple. A more realistic one weights sensors differently.
def calculate_weighted_health(asset):
    weights = {
        "temperature": 0.35,
        "vibration": 0.35,
        "pressure": 0.15,
        "rpm": 0.10,
        "voltage": 0.05,
    }

    score = 100.0

    for sensor in asset.sensors.filter(is_active=True):
        latest = sensor.readings.order_by("-recorded_at").first()
        if not latest:
            continue

        weight = weights.get(sensor.sensor_type, 0.10)
        if latest.value < sensor.min_threshold or latest.value > sensor.max_threshold:
            score -= 100 * weight

    return max(0, score)
This is closer to real industrial logic because vibration and temperature usually matter more than less critical measurements.
22. Styling Ideas
Since dashboards usually uses modern cards and clean layouts, you can present the dashboard with:
- dark theme
- statistic cards
- pill-style status badges
- warning and critical cards
- line charts with recent telemetry
- asset detail cards
- “Back to Tools” top navigation
- tabs for Overview, Telemetry, Alerts, Maintenance
A digital twin dashboard looks especially strong with a dark interface because it feels like a modern control center.
23. Why This Project Is Excellent for Learning Django
This single project teaches many essential concepts at once:
- models and relationships
- time-series data handling
- forms
- dashboard rendering
- business logic separation
- API creation
- alerts and conditions
- charts in templates
- simulator integration
- scalable architecture
24. Final Result
At the end, your project will be able to:
- represent a real machine digitally
- receive sensor readings
- compute live machine health
- show current warnings and critical events
- visualize telemetry in charts
- act like a foundation for predictive maintenance
That is a real digital twin dashboard, not just a theoretical example.
💬 Comments
No comments yet. Be the first to comment!
Login to comment.