Introduction
Deploying an AI agent is not the end of the engineering process. It is the beginning of a continuous operational responsibility.
A traditional application often follows relatively predictable execution paths. A request enters the system, business logic runs, a database or API is contacted, and a response is returned. When the application fails, engineers usually investigate familiar signals such as exceptions, response times, resource consumption, and service availability.
An AI agent behaves differently.
It may interpret the same request in different ways, choose different tools, generate different arguments, retrieve different documents, retry failed actions, consult memory, ask another agent for help, or stop before completing the task. The infrastructure may remain technically healthy while the agent gives an inaccurate answer, selects the wrong tool, consumes excessive tokens, exposes sensitive information, or performs an action the user did not intend.
This is why monitoring only uptime, CPU usage, memory consumption, and HTTP errors is insufficient for production AI agents.
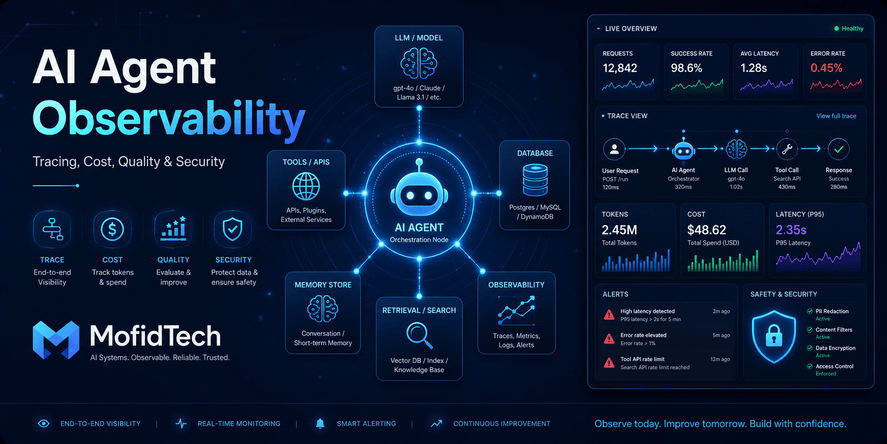
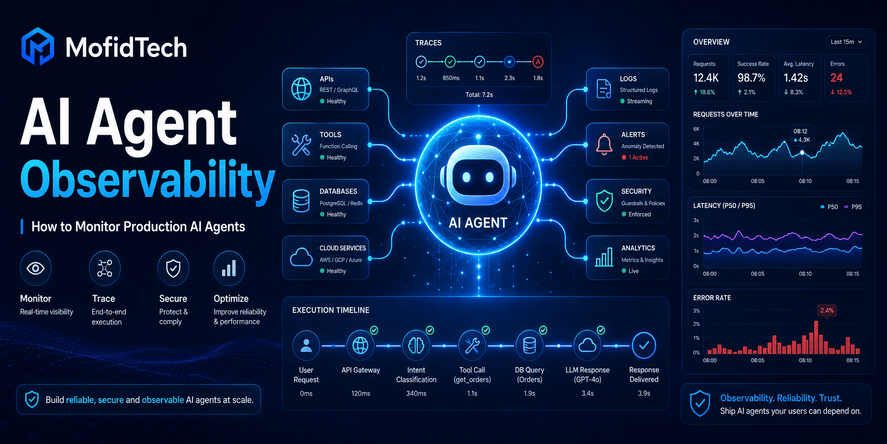
AI agent observability is the practice of making the agent’s execution understandable. It connects operational telemetry with model behavior, tool activity, quality evaluation, security controls, costs, and business outcomes.
The goal is not to expose private internal reasoning or record unlimited amounts of sensitive content. The goal is to create enough structured evidence to answer important operational questions:
- What task was the agent asked to complete?
- Which model, tools, data sources, and memory records did it use?
- Where did time and money get consumed?
- Did each tool call succeed?
- Did the agent follow the expected workflow?
- Was the final result accurate, safe, and useful?
- Did a human need to intervene?
- Can the incident be reconstructed?
- Can the same failure be prevented in the future?
The need for this discipline is growing. A Stack Overflow workplace survey published in May 2026 reported that 59% of respondents used AI agents at work at some frequency, compared with 31% in its 2025 Developer Survey. Accuracy and security remained the two leading concerns identified in the survey.
At the same time, observability standards are evolving. OpenTelemetry now provides generative AI semantic conventions intended to standardize the way model operations, token counts, tool calls, and related telemetry are represented. OpenTelemetry’s May 2026 guidance describes how an agent interaction can be analyzed as a chain of model calls, tool invocations, token exchanges, metrics, and events rather than as a single opaque request.
This guide explains how to design an AI agent observability strategy that is useful, secure, scalable, and vendor-neutral.
Table of Contents
- What Is AI Agent Observability?
- Why Traditional Monitoring Is Not Enough
- Monitoring, Observability, Evaluation, and Auditing
- Why AI Agents Fail Differently
- The Main Layers of AI Agent Observability
- The Most Important AI Agent Metrics
- How Distributed Tracing Works for AI Agents
- What an AI Agent Trace Should Contain
- OpenTelemetry for AI Agent Observability
- Monitoring Agent Quality
- Monitoring AI Agent Costs
- Monitoring Tool Calls and External Systems
- Monitoring Retrieval and Memory
- Monitoring Multi-Agent Systems
- Security and Privacy Considerations
- Designing Effective Dashboards
- Designing Useful Alerts
- Human-in-the-Loop Monitoring
- A Practical Observability Architecture
- Troubleshooting Common Agent Problems
- Common Observability Mistakes
- Choosing an Observability Platform
- Production Implementation Roadmap
- AI Agent Observability Checklist
- Frequently Asked Questions
- Conclusion
What Is AI Agent Observability?
AI agent observability is the ability to inspect, measure, and understand an agent’s behavior throughout the complete lifecycle of a task.
It covers more than whether the agent process is running. A useful observability system should explain:
- What the user requested
- How the request was classified
- Which agent or workflow handled it
- Which model was selected
- Which tools were considered
- Which tools were called
- Whether those calls succeeded
- Which documents or memory records were retrieved
- How long each step took
- How many tokens were consumed
- How much the task cost
- Whether guardrails were triggered
- Whether the final output met quality expectations
- Whether the user’s intended objective was achieved
The central unit of observation should usually be the complete task or agent run, not an isolated model request.
An agent may call a model several times during one task. It may also call multiple APIs, query a database, retrieve documents, summarize tool outputs, validate the result, and request human approval. Looking at only one model call provides an incomplete view.
A production observability system should therefore connect all relevant steps under a shared execution context.
A Practical Definition
A practical definition is:
AI agent observability is the structured collection and analysis of traces, metrics, logs, evaluations, security events, costs, and outcomes needed to understand and improve an agent’s production behavior.
This definition includes both technical and nontechnical success.
An agent that returns a response in two seconds but gives the wrong answer is not operating successfully.
An agent that completes a task accurately but spends ten times the expected amount may also be failing operationally.
An agent that produces a good result by accessing data it was not authorized to use represents a security failure even if the user is satisfied.
True observability must consider the complete outcome.
Why Traditional Monitoring Is Not Enough
Traditional monitoring remains necessary. Teams should still monitor infrastructure availability, service errors, network failures, database latency, queue delays, and resource consumption.
However, these signals do not explain many AI-specific problems.
A server can report perfect uptime while the agent:
- Selects an irrelevant tool
- Repeats the same action
- Retrieves outdated documents
- Uses the wrong customer’s memory
- Produces unsupported claims
- Ignores an approval requirement
- Generates invalid arguments for an API
- Stops before completing the task
- Consumes an excessive number of tokens
- Returns an unsafe recommendation
- Misinterprets the user’s objective
Microsoft’s 2026 guidance on observability for generative and agentic systems emphasizes that traditional latency, error, and throughput signals are too narrow on their own. It notes that uptime and error rates are not reliable indicators of AI-system quality because agent behavior can change according to inputs, retrieved context, tool outputs, and policy decisions.
Traditional Monitoring Versus Agent Observability
| Area | Traditional Monitoring | AI Agent Observability |
|---|---|---|
| Primary concern | System health | System behavior and task outcomes |
| Typical unit | Request or service | Complete agent run |
| Common signals | Errors, latency, CPU, memory | Traces, tools, tokens, evaluations, costs, outcomes |
| Execution path | Usually predictable | Dynamic and potentially nondeterministic |
| Failure definition | Exception or unavailable service | Incorrect, unsafe, costly, incomplete, or unauthorized result |
| Quality measurement | Usually outside monitoring | Core observability requirement |
| External actions | API dependency monitoring | Tool choice, arguments, permissions, and consequences |
| Security | Infrastructure and application events | Infrastructure plus prompts, tools, retrieval, memory, and agent actions |
| Cost analysis | Compute and service cost | Cost per model call, run, task, user, and successful outcome |
Traditional telemetry answers, “Is the application running?”
AI agent observability must also answer, “Is the agent behaving correctly?”
Monitoring, Observability, Evaluation, and Auditing
These terms are related but should not be treated as identical.
Monitoring
Monitoring tracks known indicators and predefined conditions.
Examples include:
- Task failure rate
- Average latency
- Token consumption
- Tool timeout rate
- Cost per task
- Number of human escalations
- Percentage of outputs below a quality threshold
Monitoring is especially useful for dashboards, alerts, and service-level objectives.
Observability
Observability helps teams investigate questions they did not fully anticipate.
It connects telemetry so that engineers can explore an agent run from the user request to the final outcome.
Good observability supports questions such as:
- Why did latency increase only for requests using a specific tool?
- Why did one model version produce more retries?
- Why are tasks for a specific customer segment more expensive?
- Which retrieved source caused unsupported outputs?
- Why did the agent bypass the normal approval step?
Monitoring tells you that something is wrong. Observability helps explain why.
Evaluation
Evaluation measures whether the agent’s output or behavior meets an expected quality, safety, or task-performance standard.
Possible evaluation dimensions include:
- Task completion
- Correctness
- Relevance
- Groundedness
- Tool-selection accuracy
- Argument accuracy
- Policy compliance
- Safety
- Completeness
- User satisfaction
Microsoft describes evaluation, monitoring, and tracing as complementary capabilities. Its current guidance distinguishes evaluation of quality and safety from operational dashboards and distributed tracing of model calls, tool invocations, agent decisions, and dependencies.
Auditing
Auditing creates an accountable record of actions, especially where agents interact with sensitive data or perform consequential operations.
An audit record may need to show:
- Who initiated the task
- Which identity the agent used
- What permissions were available
- Which resource was accessed
- Which action was attempted
- Whether approval was obtained
- Whether the action succeeded
- What changed as a result
Observability is designed primarily for understanding and improving systems. Auditing is designed primarily for accountability, investigation, and compliance.
In important workflows, teams usually need both.
Why AI Agents Fail Differently from Traditional Software
AI-agent failures often emerge from combinations of model behavior, external systems, context, permissions, and workflow design.
Nondeterministic Behavior
A deterministic function is expected to produce the same result when given the same input and environment.
An AI agent may produce different intermediate decisions or outputs across repeated runs. Variability can result from model sampling, prompt changes, context differences, provider updates, retrieved documents, or tool responses.
This does not mean AI agents cannot be tested. It means testing must focus on acceptable behavior ranges, task outcomes, safety constraints, and statistical performance rather than only exact string equality.
Multi-Step Failure Propagation
A small error early in a workflow can affect every later step.
For example:
- The agent misclassifies the user’s objective.
- It chooses the wrong tool.
- The tool returns technically valid but irrelevant data.
- The agent summarizes that data confidently.
- The final response appears polished but does not solve the task.
The final output alone may not reveal where the failure started. A trace is needed to reconstruct the path.
External Tool Uncertainty
Agents frequently depend on systems they do not control:
- Search services
- Browsers
- Databases
- SaaS platforms
- Internal APIs
- Payment systems
- Email services
- File repositories
- Customer relationship systems
- Model providers
A tool may be unavailable, slow, rate-limited, incorrectly configured, or returning unexpected data. The agent may also misuse a healthy tool.
Therefore, observability must distinguish between:
- Tool infrastructure failure
- Authentication failure
- Authorization failure
- Invalid tool arguments
- Incorrect tool selection
- Unexpected tool output
- Agent misinterpretation of a valid result
Context and Retrieval Problems
An agent can fail because it received poor context rather than because the model itself is weak.
Common context failures include:
- Irrelevant retrieval results
- Missing documents
- Stale information
- Conflicting sources
- Excessive context
- Truncated context
- Incorrect tenant filtering
- Unsafe user-provided instructions
- Memory records associated with the wrong person
This is why retrieval and memory must be observable components rather than invisible preprocessing steps.
Silent Quality Regression
An agent can continue returning successful HTTP responses while quality declines.
Possible causes include:
- A model version change
- A modified system instruction
- A new retrieval index
- Different document chunking
- A changed tool description
- A lower cost model
- A new routing rule
- Increased context length
- A framework update
- A changed safety policy
Without continuous evaluations and version-aware telemetry, quality regressions may remain hidden until users complain.
The Main Layers of AI Agent Observability
A complete strategy should cover several connected layers.
User and Session Layer
This layer captures the context of the request without unnecessarily exposing personal data.
Useful attributes may include:
- Request identifier
- Session identifier
- Tenant or organization identifier
- User role
- Channel, such as web, mobile, API, or internal application
- Locale or language
- Subscription level
- Request category
- Risk classification
- Whether the task requires human approval
Sensitive identifiers should be minimized, hashed, tokenized, or replaced with internal references when possible.
Agent and Workflow Layer
This layer describes the agent responsible for the task.
Useful information includes:
- Agent name
- Agent version
- Workflow name
- Workflow version
- Agent role
- Parent and child agents
- Execution status
- Number of steps
- Stop reason
- Retry count
- Human-intervention status
- Final task result
Model Layer
The model layer records the model operations used during the run.
Important signals include:
- Provider
- Model name
- Model version or deployment identifier
- Request duration
- Input token count
- Output token count
- Cached token usage when available
- Error status
- Rate-limit status
- Response stop reason
- Routing decision
- Fallback use
Recording exact prompts and completions should be optional and controlled because they may contain sensitive data.
Tool Layer
The tool layer explains how the agent interacts with external systems.
It may capture:
- Tool name
- Tool category
- Tool version
- Start and end time
- Arguments or sanitized argument summary
- Permission scope
- Result status
- Output size
- Error category
- Retry behavior
- Side effects
- Approval requirement
Retrieval Layer
For retrieval-augmented agents, capture:
- Search query or sanitized representation
- Retrieval index
- Dataset version
- Number of documents retrieved
- Document identifiers
- Relevance scores
- Access filters
- Source timestamps
- Reranking status
- Whether cited sources support the final answer
Memory Layer
Memory observability may include:
- Memory store used
- Read and write operations
- Number of records accessed
- Memory age
- User or tenant boundary
- Confidence or relevance
- Whether memory influenced the result
- Whether the user corrected or deleted a memory
Infrastructure Layer
Traditional infrastructure signals remain important:
- Service availability
- Queue depth
- Worker utilization
- Database latency
- Cache performance
- Network failures
- Storage errors
- Model-provider availability
- Resource saturation
Evaluation Layer
This layer records quality and safety measurements.
Examples include:
- Task completion score
- Groundedness score
- Relevance score
- Tool-selection score
- Tool-argument score
- Policy-compliance result
- Hallucination indicator
- Safety classification
- Human-review result
Business Outcome Layer
The final layer connects technical execution with user or organizational value.
Possible outcomes include:
- Issue resolved
- Appointment scheduled
- Report generated
- Order completed
- Incident escalated
- Support ticket avoided
- User correction requested
- User abandoned the workflow
- Human agent took over
- Revenue or cost impact
Without the business outcome, teams may optimize the wrong metrics.
The Most Important AI Agent Metrics
No single metric represents agent reliability. Teams need a balanced set of operational, quality, cost, security, and business measures.
Task Completion Rate
Task completion rate measures the percentage of runs that reach the intended result.
The definition must be specific to the workflow.
For a support agent, task completion might mean that the user’s issue was resolved without escalation.
For a booking agent, it may mean that a valid appointment was created and confirmed.
For a research agent, completion may require that the final answer addresses the requested scope and includes supporting sources.
A technically generated response is not necessarily a completed task.
First-Pass Success Rate
This metric measures how often the agent completes the task without retries, corrections, fallbacks, or human intervention.
A high task completion rate combined with a low first-pass success rate can hide inefficiency.
End-to-End Latency
End-to-end latency measures the total time from receiving the user request to delivering the final outcome.
It should be separated into stages:
- Initial interpretation
- Model processing
- Retrieval
- Tool execution
- Memory access
- Validation
- Approval waiting time
- Final response generation
Percentiles are usually more informative than averages. A reasonable average may conceal a small group of extremely slow runs.
Model Latency
Measure model latency separately for each provider, model, operation type, and region.
This helps determine whether slow responses are caused by:
- The model provider
- Large input context
- Long output generation
- Rate limiting
- Retries
- Routing
- Network conditions
Tool Success Rate
Tool success rate should distinguish between:
- Successful execution
- Invalid arguments
- Authentication failure
- Permission denial
- Timeout
- Rate limit
- Tool unavailable
- Invalid output
- Agent rejection of the result
Tool-Selection Accuracy
A tool can execute successfully even when it should not have been selected.
Tool-selection accuracy evaluates whether the agent chose an appropriate tool for the task.
This metric often requires test datasets, business rules, or sampled human evaluation.
Retry Rate
Retries are useful when temporary failures occur, but excessive retries can signal:
- Weak prompts
- Bad tool descriptions
- Poor response validation
- Unstable services
- Looping behavior
- Inadequate stop conditions
- Model incompatibility
Measure retries by model call, tool call, workflow step, and complete task.
Loop Rate
A loop occurs when the agent repeats similar actions without meaningful progress.
Potential indicators include:
- Repeated identical tool calls
- Repeated near-identical search queries
- Repeated validation failures
- Alternating between the same two actions
- Token consumption without state improvement
Token Consumption
Track:
- Input tokens
- Output tokens
- Cached tokens
- Tokens by model
- Tokens by workflow step
- Tokens per task
- Tokens per successful task
- Tokens per user or tenant
A high token count is not automatically bad. It becomes a concern when it does not produce proportional value.
Cost per Run
Cost per run measures the total model and tool expense associated with one execution.
It may include:
- Model input costs
- Model output costs
- Search or retrieval costs
- External API fees
- Browser automation
- Storage
- Evaluation costs
- Observability storage
Cost per Successful Outcome
This is often more useful than cost per run.
If an agent costs less per request but fails more frequently, it may be more expensive per successful result.
Human Escalation Rate
Track the percentage of tasks transferred to a human and classify why:
- Low confidence
- Policy requirement
- User request
- Tool failure
- Security risk
- Complex case
- Quality failure
- Missing information
The goal is not always to minimize escalation. In high-risk situations, correct escalation is a success.
User Correction Rate
Measure how often users:
- Restate the request
- Correct a factual error
- Reject the answer
- Undo an action
- Ask the agent to try again
- Provide information already supplied
User correction is a valuable real-world quality signal.
Quality Scores
Quality metrics should reflect the application.
Common examples include:
- Relevance
- Correctness
- Completeness
- Groundedness
- Coherence
- Citation support
- Policy compliance
- Appropriate tool use
Security Metrics
Security-focused metrics may include:
- Prompt-injection detections
- Unauthorized access attempts
- Sensitive-data detections
- Blocked tool calls
- Privilege violations
- Cross-tenant access attempts
- Unusual tool sequences
- Excessive data retrieval
- Approval bypass attempts
AI Agent Metric Categories
| Category | Example Metrics | Main Question |
|---|---|---|
| Reliability | Completion rate, retry rate, tool success | Does the agent finish the task? |
| Performance | End-to-end latency, model latency, tool latency | Is the agent fast enough? |
| Quality | Relevance, correctness, groundedness | Is the result useful and accurate? |
| Cost | Cost per run, tokens per outcome | Is the agent economically efficient? |
| Safety | Harmful-output rate, policy violations | Is the agent operating safely? |
| Security | Unauthorized actions, injection detections | Is the system being misused or attacked? |
| User experience | Correction rate, abandonment, satisfaction | Are users benefiting? |
| Business impact | Resolutions, conversions, completed workflows | Is the agent achieving its purpose? |
How Distributed Tracing Works for AI Agents
Distributed tracing reconstructs the path of a task across multiple components.
A complete task is represented as a trace. Individual operations inside the task are represented as spans.
Trace
A trace represents the full execution of one agent task.
For example, a trace may begin when the user asks an agent to compare invoices and create a summary. It ends when the result is returned, saved, escalated, or abandoned.
Span
A span represents one operation within the trace.
Possible spans include:
- Agent run
- Model call
- Tool invocation
- Database query
- Retrieval operation
- Memory lookup
- Policy check
- Human approval
- Output evaluation
- Response delivery
Spans can be nested to show parent-child relationships.
Event
An event represents something that occurred at a particular moment during a span.
Examples include:
- Tool call requested
- Retry started
- Guardrail triggered
- User approval received
- Fallback selected
- Evaluation completed
Attribute
An attribute adds structured context.
Examples include:
- Model name
- Tool name
- Token count
- User role
- Agent version
- Error category
- Workflow type
- Tenant identifier
- Evaluation score
Why Tracing Matters
Without tracing, engineers often see disconnected records:
- A model request in one system
- An API error in another
- A database entry elsewhere
- A user complaint in a support tool
- A cost report from the model provider
A shared trace identifier connects these events into one investigation.
OpenTelemetry’s 2026 GenAI guidance describes the model call, tool invocations, token exchanges, traces, metrics, and events as related parts of an AI interaction. It also notes that prompt, completion, tool-call, and tool-result content may be recorded when teams explicitly opt in.
What an AI Agent Trace Should Contain
The trace should provide enough detail for investigation without becoming a copy of every piece of data processed.
Trace-Level Information
At the complete-run level, capture:
- Trace identifier
- Start and end time
- Agent name and version
- Workflow name and version
- Request category
- Execution environment
- User or tenant reference
- Risk level
- Final status
- Total latency
- Total token usage
- Total estimated cost
- Human-intervention status
- Final task outcome
- Evaluation summary
Model-Call Information
For each model call, consider recording:
- Provider
- Model or deployment name
- Operation type
- Request start and end time
- Input token count
- Output token count
- Cache usage
- Stop reason
- Response status
- Retry count
- Error category
- Prompt template version
- Routing rule
- Whether sensitive content capture was enabled
Tool-Call Information
For each tool invocation, record:
- Tool name
- Tool version
- Purpose
- Sanitized arguments or argument classification
- Authentication context
- Permission scope
- Start and end time
- Result status
- Output classification
- Error details
- Retry count
- Whether the action had side effects
- Whether approval was required
- Whether approval was granted
Retrieval Information
For retrieval, record:
- Search or retrieval operation identifier
- Query category
- Index or knowledge-base version
- Access filters
- Number of results
- Document identifiers
- Relevance scores
- Reranking result
- Source age
- Whether sources were used in the final answer
Evaluation Information
For evaluations, capture:
- Evaluator type
- Evaluator version
- Evaluation timestamp
- Score
- Threshold
- Pass or fail result
- Reason category
- Whether a human reviewed the output
Error Information
Errors should be classified rather than stored only as free text.
Useful error categories include:
- Model provider unavailable
- Rate limited
- Tool timeout
- Authentication failed
- Authorization denied
- Invalid tool arguments
- Empty retrieval
- Unsafe content blocked
- Output validation failed
- Maximum steps reached
- Budget exceeded
- Human approval expired
- Internal application failure
Structured categories make dashboards and alerts more useful.
OpenTelemetry for AI Agent Observability
OpenTelemetry is an open-source observability framework that provides standard APIs, libraries, collectors, and data conventions for telemetry such as traces and metrics. Its purpose is to allow applications to produce observability data in a consistent, vendor-neutral way.
Why Semantic Conventions Matter
Two applications may record the same concept under different names.
One team may use “model,” another “model_name,” and another “llm.deployment.” This makes dashboards, integrations, and analysis difficult.
Semantic conventions provide common names and meanings for telemetry fields.
OpenTelemetry explains that semantic conventions define shared attributes, span names, metric instruments, units, data types, and valid values. The benefit is easier correlation and consumption across codebases, libraries, and platforms.
GenAI Semantic Conventions
The OpenTelemetry GenAI conventions are intended to standardize telemetry for generative AI operations.
Depending on the implementation and maturity of the conventions, teams may represent:
- Model operations
- Agent operations
- Tool calls
- Input and output token counts
- Model identifiers
- Response status
- Prompts and outputs when explicitly enabled
- Metrics and events related to AI interactions
Microsoft’s Agent Framework documentation states that the framework integrates with OpenTelemetry and emits traces, logs, and metrics according to OpenTelemetry GenAI semantic conventions. It also warns that enabling sensitive-data capture can produce duplicate prompt and response information at different instrumentation layers.
Benefits of Open Standards
Using open conventions can provide:
- Consistent telemetry across frameworks
- Easier integration with multiple backends
- Reduced vendor lock-in
- Shared dashboards
- Better cross-team comparison
- Easier migration
- More reusable instrumentation
- Better correlation with existing application traces
Important Limitations
Standards do not solve every observability problem automatically.
Teams must still decide:
- Which data to record
- Which content is sensitive
- How long to retain telemetry
- How to sample traces
- How to define task success
- How to evaluate quality
- How to associate technical data with business outcomes
- How to handle framework-specific behavior
AI observability conventions are also evolving. Instrumentation should therefore be versioned and reviewed regularly.
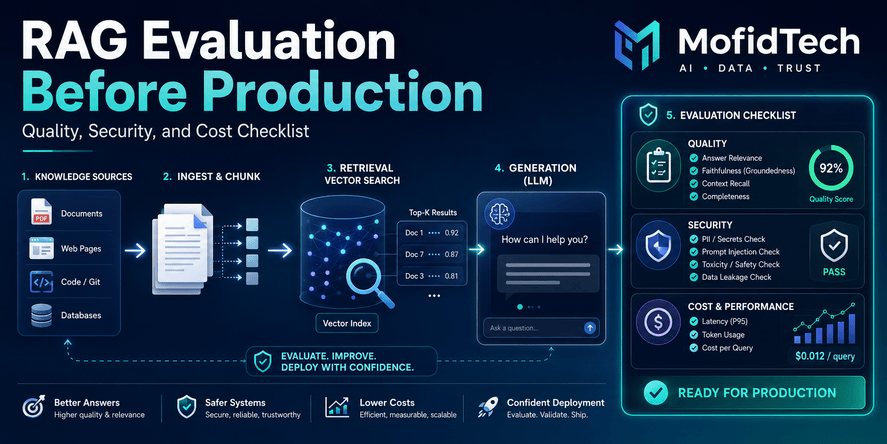
Monitoring Agent Quality
Operational health does not prove quality.
A production agent needs a continuous evaluation strategy.
Offline Evaluation
Offline evaluation is performed using controlled datasets before deployment.
A good evaluation dataset may include:
- Normal user requests
- Difficult edge cases
- Ambiguous requests
- Tool failures
- Missing data
- Adversarial inputs
- Policy-sensitive scenarios
- Multilingual requests
- Long conversations
- Previously observed production failures
Offline evaluations are useful for comparing:
- Models
- Prompt versions
- Retrieval strategies
- Tool descriptions
- Workflow changes
- Safety controls
- Routing logic
Online Evaluation
Online evaluation measures real production behavior.
Because evaluating every production interaction may be expensive or privacy-sensitive, teams can use:
- Random sampling
- Risk-based sampling
- Failure-based sampling
- New-version sampling
- Customer-segment sampling
- Human review of high-impact cases
Deterministic Evaluation
Deterministic checks use explicit rules.
Examples include:
- Was the required field present?
- Was the expected tool called?
- Did the workflow reach the confirmation state?
- Were all required sources cited?
- Did the action remain within the user’s permission scope?
- Was the output in the required language?
These checks are usually reliable and inexpensive.
Model-Based Evaluation
A model can assess criteria such as relevance, completeness, or groundedness.
However, model-based evaluators have limitations:
- They can be inconsistent.
- They may share weaknesses with the evaluated system.
- They may favor particular writing styles.
- They may require calibration.
- They add cost and latency.
They should be validated against human judgments and combined with deterministic checks where possible.
Human Evaluation
Human review remains important for:
- High-risk decisions
- Complex domain accuracy
- Legal or medical workflows
- New agent capabilities
- Security incidents
- Customer complaints
- Evaluator calibration
Outcome-Based Evaluation
Outcome-based metrics are often the most meaningful.
Instead of asking only whether the response looked good, measure whether:
- The user’s problem was resolved
- The requested action was completed
- The generated report was accepted
- The user avoided repeating the request
- A human did not need to correct the action
- The business process reached the expected state
Monitoring AI Agent Costs
Agentic workflows can be more expensive than single model calls because an agent may perform several reasoning, retrieval, validation, and tool steps.
Why Total Token Usage Is Not Enough
Total token consumption shows volume but not efficiency.
A useful cost strategy should answer:
- Which workflow consumes the most?
- Which steps generate unnecessary context?
- Which tools cause retries?
- Which model is used for each operation?
- How much does a successful task cost?
- Which customer or tenant generates abnormal cost?
- Are expensive runs producing better outcomes?
- Are cached inputs reducing cost?
- Are evaluation calls included?
Cost Per Run
Cost per run helps identify expensive individual executions.
However, one complex successful run may legitimately cost more than a simple request.
Cost Per Successful Task
This metric connects cost with value.
Consider two agents:
| Agent | Cost per Run | Success Rate | Approximate Cost per Successful Task |
|---|---|---|---|
| Agent A | Low | Low | Potentially high |
| Agent B | Moderate | High | Potentially lower |
| Agent C | High | High | May be justified for high-value work |
The cheapest model call is not always the cheapest completed workflow.
Cost by Step
Break down cost by:
- Intent classification
- Planning
- Retrieval
- Main reasoning
- Tool selection
- Validation
- Final response
- Evaluation
- Fallback
This reveals where optimization is possible.
Common Causes of Excessive Cost
- Sending the full conversation on every call
- Retrieving too many documents
- Repeating unchanged context
- Using a large model for simple classification
- Allowing long outputs without need
- Retrying without changing the strategy
- Running evaluations on every low-risk request
- Keeping irrelevant memory in the prompt
- Failing to stop after task completion
- Calling tools that do not contribute to the result
Cost Controls
Possible controls include:
- Per-run token budgets
- Per-user or per-tenant budgets
- Maximum workflow steps
- Model-routing policies
- Context-size limits
- Retrieval-result limits
- Retry limits
- Daily anomaly alerts
- Approval for high-cost operations
- Graceful degradation to simpler workflows
A cost limit should not simply terminate the task without explanation. The workflow should define what happens when the budget is reached.
Monitoring Tool Calls and External Systems
Tool use is one of the most important differences between a simple chatbot and an AI agent.
A tool can create real-world consequences. Therefore, tool observability must cover both technical execution and behavioral correctness.
Tool Selection
Ask:
- Was a tool necessary?
- Was the correct tool selected?
- Was the selected tool permitted for this user?
- Was a safer read-only tool available?
- Did the agent call multiple tools unnecessarily?
Tool Arguments
Valid arguments are not always correct arguments.
An agent may provide:
- The wrong customer identifier
- An incorrect date
- An excessive date range
- An unsafe file path
- An unauthorized destination
- A destructive action instead of a read action
Argument validation should be visible in traces.
Tool Results
Record whether the tool result was:
- Successful
- Empty
- Partial
- Stale
- Malformed
- Unauthorized
- Rate-limited
- Timed out
- Rejected by validation
Tool Side Effects
Tools should be classified by consequence:
- Read-only
- Internal write
- External communication
- Financial action
- Account modification
- Data deletion
- Security-sensitive action
High-impact tools require stronger logging, authorization, approval, and audit controls.
Tool Permission Monitoring
The agent should not receive broad permissions merely because the tool can technically support them.
Monitor:
- Which identity was used
- Which permissions were granted
- Whether permissions matched the task
- Whether privilege elevation occurred
- Whether the user authorized the action
- Whether access crossed tenant boundaries
Tool Dependency Health
Track tool-specific:
- Availability
- Latency
- Failure rate
- Rate limits
- Authentication failures
- Version changes
- Output-schema changes
This helps separate agent failures from dependency failures.
Monitoring Retrieval and Memory
Retrieval and memory can strongly influence agent outputs while remaining invisible to the user.
Retrieval Quality
A retrieval operation should be evaluated for:
- Relevance
- Coverage
- Freshness
- Authority
- Tenant isolation
- Access permission
- Diversity
- Redundancy
- Conflict
Empty Retrieval
An empty result should not automatically lead the agent to invent an answer.
Monitor how the workflow handles missing information:
- Does it state that information is unavailable?
- Does it ask the user for clarification?
- Does it use an approved fallback?
- Does it search another authorized source?
- Does it escalate?
Conflicting Sources
When retrieved sources disagree, the system should not silently choose one without evidence.
Observability should show:
- Which sources conflicted
- Which source was selected
- Why it was selected
- Whether uncertainty was disclosed
- Whether a human decision was required
Source Freshness
Record source timestamps or dataset versions where freshness matters.
A technically relevant document may still be unsuitable if it is outdated.
Memory Reads
Memory observability should explain:
- Which records were accessed
- Why they were considered relevant
- How old they were
- Which user or tenant owned them
- Whether the records affected the output
Memory Writes
Track:
- What type of information was stored
- Why it was stored
- Which policy permitted storage
- How long it will be retained
- Whether the user can review or delete it
- Whether the information was verified
Memory Contamination
Memory contamination occurs when inaccurate, malicious, stale, or misattributed information influences future interactions.
Possible signals include:
- Sudden changes in stored preferences
- Cross-user identifiers
- Instructions stored as facts
- Repeated user corrections
- Memory records created from untrusted tool output
- High-impact actions based on unverified memory
Monitoring Multi-Agent Systems
Multi-agent systems introduce additional complexity because responsibility is distributed.
Parent and Child Traces
Each complete user task should have a root trace.
Sub-agents should create child spans or linked traces that preserve:
- Parent agent
- Delegated objective
- Input context
- Permission scope
- Start and end time
- Result
- Error
- Cost
- Quality evaluation
Delegation Quality
Monitor whether the parent agent:
- Selected the correct specialist
- Provided sufficient context
- Shared too much sensitive data
- Defined a clear expected output
- Verified the result
- Duplicated work across agents
Coordination Problems
Common multi-agent failures include:
- Two agents performing the same work
- Agents producing conflicting results
- Circular delegation
- Lost context
- Permission escalation
- Unclear ownership
- Excessive communication overhead
- One failed agent blocking the complete workflow
Cost Attribution
Costs should be attributable to:
- Root task
- Parent agent
- Child agent
- Model
- Tool
- Evaluation step
Without this attribution, multi-agent systems can become financially opaque.
Responsibility and Auditability
The final trace should show which component:
- Made each decision
- Called each tool
- Created each output
- Requested approval
- Accepted or rejected another agent’s result
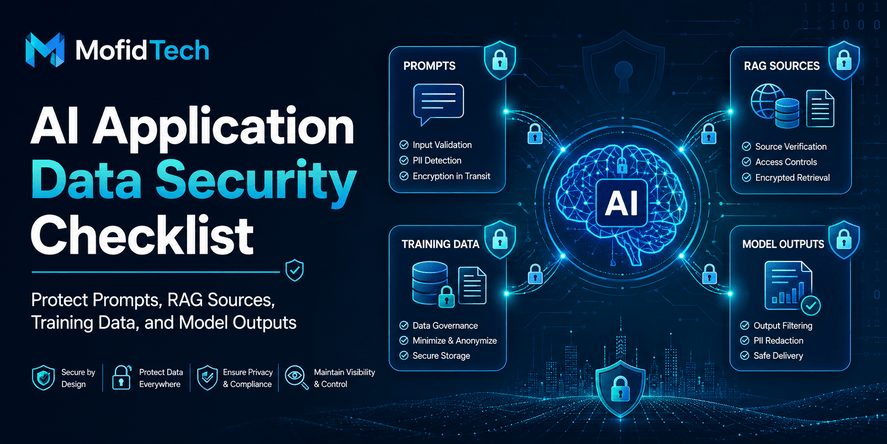
Security and Privacy Considerations
Observability systems can become repositories of highly sensitive information.
The telemetry may include:
- User prompts
- Model responses
- Personal data
- Customer records
- Internal documents
- Tool arguments
- Search queries
- API outputs
- Security decisions
- Authentication context
- Business operations
Collecting everything is not a responsible default.
Microsoft’s 2026 security guidance recommends governing AI telemetry through clear data contracts that balance forensic needs with privacy, data residency, minimization, retention, access control, encryption, and regulatory obligations.
Data Minimization
Record only what is needed for a defined purpose.
For many metrics, teams do not need full prompt content.
Instead of storing raw content, they may record:
- Request category
- Content length
- Risk classification
- Language
- Template version
- Hash or identifier
- Sensitive-data classification
- Redacted summary
Sensitive Content Capture
Full-content capture may be useful in development or controlled incident investigations, but production use should be carefully governed.
Questions to answer include:
- Is content capture disabled by default?
- Can it be enabled only for approved environments?
- Is consent required?
- Are secrets redacted before export?
- Are personal identifiers masked?
- Who can access raw traces?
- Is access logged?
- How long is content retained?
- Can data be deleted when required?
Secret Redaction
Telemetry pipelines should detect and remove:
- Passwords
- API keys
- Access tokens
- Session cookies
- Private keys
- Authorization headers
- Database credentials
- Sensitive personal identifiers
Redaction should occur before telemetry reaches external storage whenever possible.
Access Control
Different users need different levels of observability access.
For example:
- Developers may view technical metadata.
- Support staff may view limited user-facing context.
- Security teams may access threat-related details.
- Compliance teams may access audit records.
- Only a restricted incident group may view raw content.
Retention
Not all telemetry needs the same retention period.
Possible categories include:
- High-volume operational metrics
- Sampled traces
- Error traces
- Security incidents
- Audit records
- Raw content
- Evaluation results
Retention should reflect operational need, legal requirements, privacy risk, and storage cost.
Telemetry Integrity
Attackers may attempt to manipulate observability.
Protect against:
- Deleted traces
- Modified audit events
- Fake success signals
- Log injection
- Untrusted text being interpreted as metadata
- Disabled instrumentation
- Selective omission of harmful actions
Important audit events may need tamper-resistant storage.
Cross-Tenant Isolation
Multi-tenant systems must prevent:
- One customer viewing another’s traces
- Shared dashboards exposing identifiers
- Cross-tenant memory access
- Export pipelines mixing data
- Support users accessing unauthorized content
Tenant identifiers should be enforced at storage, query, and dashboard levels.
Designing Effective Dashboards
A dashboard should help a specific audience make a decision.
Avoid creating one overloaded dashboard for everyone.
Executive or Product Dashboard
Focus on:
- Total task volume
- Task completion
- User satisfaction
- Cost per successful outcome
- Human escalation
- Business impact
- Major quality trends
- High-level risk indicators
Engineering Dashboard
Focus on:
- End-to-end latency
- Model latency
- Tool latency
- Error categories
- Retry rate
- Loop rate
- Token usage
- Version comparison
- Dependency health
AI Quality Dashboard
Focus on:
- Task-completion scores
- Groundedness
- Relevance
- Tool-selection accuracy
- Evaluation pass rates
- User correction
- Quality by model or prompt version
- Regression trends
Security Dashboard
Focus on:
- Prompt-injection detections
- Unauthorized actions
- Blocked tools
- Sensitive-data events
- Unusual retrieval
- Cross-tenant attempts
- Privilege violations
- High-risk agent runs
Cost Dashboard
Focus on:
- Cost by agent
- Cost by workflow
- Cost by model
- Cost by user or tenant
- Cost per successful task
- High-cost outliers
- Retry-related cost
- Evaluation cost
- Budget consumption
Dashboard Design Principles
A useful dashboard should:
- Display trends, not only totals
- Show percentiles for latency
- Allow filtering by model and version
- Link aggregate metrics to traces
- Separate expected failures from incidents
- Show task outcome beside technical status
- Make data freshness visible
- Avoid exposing sensitive content unnecessarily
Designing Useful Alerts
An alert should indicate that someone needs to act.
Alerting on every agent error creates fatigue and hides serious incidents.
Reliability Alerts
Examples include:
- Task completion below the accepted threshold
- Sudden increase in failed runs
- Tool failure affecting multiple workflows
- Retry-loop rate above normal
- Maximum-step terminations increasing
Performance Alerts
Examples include:
- End-to-end latency above the service objective
- Model latency degradation
- Tool timeout increase
- Queue delay
- Retrieval latency increase
Cost Alerts
Examples include:
- Cost per successful task above budget
- Sudden token-consumption increase
- Abnormally expensive single run
- Tenant budget nearing its limit
- Unexpected use of a premium model
- Retry costs exceeding normal behavior
Quality Alerts
Examples include:
- Evaluation scores below threshold
- Increased user corrections
- Groundedness decline
- Tool-selection accuracy regression
- Higher human-review rejection rate
Security Alerts
Examples include:
- Unauthorized tool attempts
- Repeated prompt-injection detections
- Sensitive-data exposure
- Cross-tenant retrieval attempt
- Approval bypass
- Unusual volume of data access
- Agent behavior outside its normal profile
Alert Context
Every alert should provide:
- Affected agent and workflow
- Version
- Time window
- Severity
- Number of users affected
- Relevant metrics
- Example trace identifiers
- Suspected dependency
- Recommended investigation path
- Runbook or owner
Baseline-Based Alerts
Static thresholds are useful but may miss unusual behavior.
Behavioral baselines can identify:
- A normally low-volume agent suddenly making many tool calls
- A read-only agent attempting write operations
- A workflow using a model it never used before
- A tenant generating abnormal token usage
- A retrieval agent accessing an unexpected data source
Baseline alerts should be reviewed carefully to avoid excessive false positives.
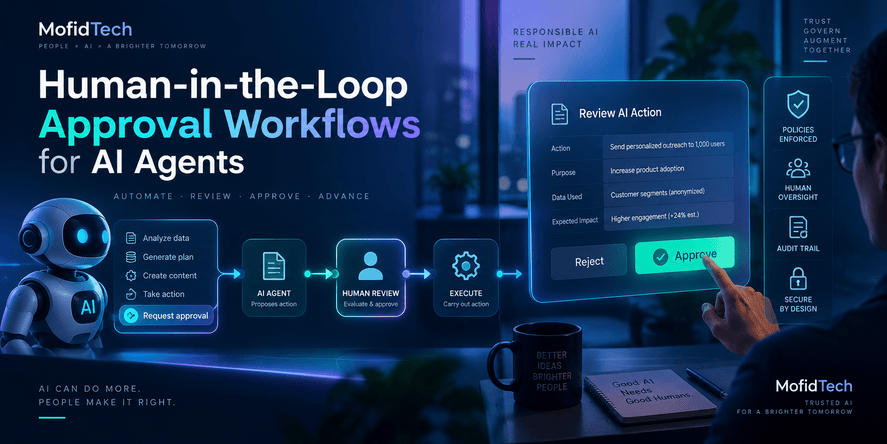
Human-in-the-Loop Monitoring
Human intervention is an important safety and quality mechanism.
It should be observable rather than treated as an exception outside the system.
When Human Approval Is Appropriate
Approval may be required for:
- Financial transactions
- Data deletion
- Account changes
- External communications
- Legal submissions
- High-impact recommendations
- Access to sensitive information
- Irreversible actions
- Low-confidence decisions
What to Record
Capture:
- Why approval was requested
- Who received the request
- What information was shown
- Whether the proposed action changed
- Who approved or rejected it
- Approval timestamp
- Approval delay
- Final result
Measuring Human Intervention
Useful metrics include:
- Approval-request rate
- Approval rate
- Rejection rate
- Time waiting for approval
- Changes made before approval
- Escalation reason
- Outcome after intervention
A high approval rate may indicate that the workflow is appropriately cautious, or it may indicate that approvals are being requested unnecessarily. Context matters.
A Practical AI Agent Observability Architecture
A general architecture can be organized into seven stages.
1. Instrumentation
Agents, models, tools, retrieval services, memory systems, and application components produce telemetry.
Instrumentation should follow shared naming and versioning conventions.
2. Context Propagation
Trace and correlation identifiers must move across:
- Services
- Model calls
- Tools
- Queues
- Background jobs
- Sub-agents
- Human-approval systems
Without propagation, the complete task becomes fragmented.
3. Telemetry Collection
A collector receives traces, metrics, and logs.
The collector may:
- Redact sensitive content
- Add environment metadata
- Sample high-volume traffic
- Route security events
- Transform field names
- Remove unnecessary attributes
- Export to one or more backends
4. Storage
Different signals may use different storage systems:
- Metrics store
- Trace store
- Log platform
- Evaluation database
- Audit archive
- Cost analytics warehouse
5. Evaluation
An evaluation service processes selected outputs and traces.
It may perform:
- Deterministic checks
- Model-based scoring
- Policy checks
- Regression comparison
- Human-review assignment
6. Analysis and Visualization
Dashboards, trace explorers, reports, and investigation tools provide access to the data.
7. Response and Improvement
Alerts and incidents should feed improvements into:
- Prompt design
- Tool descriptions
- Permissions
- Retrieval
- Model routing
- Evaluation datasets
- Runbooks
- Security controls
- Product design
Observability is valuable only when it leads to action.
Troubleshooting Common Agent Problems
Problem: The Agent Is Slow
Investigate:
- End-to-end trace duration
- Number of model calls
- Input and output token sizes
- Slow retrieval operations
- Tool latency
- Retries
- Queue waiting time
- Human approval delays
- Validation steps
- Provider rate limits
Do not assume the model is the cause until the trace confirms it.
Problem: The Agent Uses the Wrong Tool
Review:
- Tool descriptions
- Tool-selection prompt
- Available tool list
- User intent classification
- Similar tool names
- Permission constraints
- Training and evaluation examples
- Whether the correct tool result was available
Add tool-selection cases to the evaluation dataset.
Problem: The Agent Repeats Actions
Look for:
- Missing stop conditions
- Repeated tool errors
- Unchanged retry strategy
- Failure to store completed state
- Conflicting instructions
- Invalid output validation
- Inadequate maximum-step limits
Problem: Costs Suddenly Increase
Compare:
- Model version
- Prompt size
- Context size
- Retrieval volume
- Number of steps
- Retry rate
- Traffic mix
- Evaluation sampling
- Model routing
- Cache use
- New tools or sub-agents
Problem: Quality Declines After a Release
Compare the old and new versions across:
- Prompt template
- Model
- Retrieval index
- Tool definitions
- Memory policy
- Routing logic
- Guardrails
- Evaluation scores
- User segments
- Languages
Roll back or restrict the change when necessary.
Problem: The Agent Gives Unsupported Answers
Inspect:
- Retrieved sources
- Retrieval relevance
- Source authority
- Source freshness
- Whether citations match claims
- Whether the agent answered despite empty retrieval
- Groundedness evaluation
- Prompt instructions for uncertainty
Problem: The Agent Accesses Too Much Data
Review:
- Tool permission scope
- Retrieval filters
- User identity
- Tenant boundaries
- Query size
- Data-minimization rules
- Approval requirements
- Security alerts
Treat unusual broad access as a security event.
Problem: The Agent Succeeds Technically but Users Are Unhappy
Compare:
- Task completion definition
- User correction rate
- Abandonment
- Satisfaction feedback
- Repeated requests
- Human escalations
- Business outcome
- Evaluation criteria
The monitored success condition may not match the user’s actual objective.
Common AI Agent Observability Mistakes
Monitoring Only Infrastructure
Healthy servers do not prove healthy agent behavior.
Add task, tool, quality, cost, and outcome signals.
Recording Everything
Unlimited content collection creates privacy, security, storage, and compliance risk.
Adopt selective capture and data minimization.
Storing Prompts Without Governance
Prompts may contain personal data, secrets, confidential documents, or malicious instructions.
Use redaction, access controls, and retention policies.
Measuring Cost Without Success
A cheap failed task is not efficient.
Track cost per successful outcome.
Ignoring Tool Semantics
A successful API response does not prove that the correct tool or arguments were used.
Evaluate tool choice and business impact.
Using Only Average Latency
Averages can hide severe delays.
Use percentiles and trace-level analysis.
Failing to Version Components
Without version identifiers, teams cannot connect regressions to:
- Models
- Prompts
- Agents
- Tools
- Retrieval indexes
- Evaluation logic
- Policies
Collecting Traces That Cannot Be Correlated
A trace is much less useful if model calls, tools, application requests, and business outcomes use unrelated identifiers.
Define context propagation early.
Alerting on Every Error
Some errors are expected and safely handled.
Alert according to impact, volume, security risk, and failure of fallback mechanisms.
Treating Evaluation as a One-Time Test
Production traffic changes.
Evaluation should continue through deployment, monitoring, incident review, and regression testing.
Ignoring User Corrections
Corrections are high-value signals that can reveal failures missed by automated evaluators.
Failing to Turn Incidents into Tests
Every important production failure should create:
- A documented failure category
- An evaluation case
- A regression check
- A monitoring improvement
- A workflow or policy improvement
How to Choose an AI Agent Observability Platform
The best platform depends on architecture, scale, privacy requirements, existing tools, and team maturity.
OpenTelemetry Support
Prefer solutions that can receive or export standard telemetry.
Questions include:
- Does it support OpenTelemetry?
- Can data be exported to another backend?
- Are GenAI conventions supported?
- Can application and agent traces be correlated?
- Is instrumentation framework-neutral?
Framework Compatibility
Confirm support for:
- Agent framework
- Model providers
- Programming language
- Retrieval stack
- Tool architecture
- Multi-agent orchestration
- Cloud platform
Tracing Capabilities
Look for:
- Nested spans
- Tool-call visualization
- Model-call details
- Retrieval spans
- Multi-agent relationships
- Error classification
- Trace comparison
- Search and filtering
Evaluation Features
Consider whether the platform supports:
- Custom evaluators
- Deterministic rules
- Model-based scoring
- Human review
- Evaluation datasets
- Version comparison
- Regression testing
- Production sampling
Cost Analytics
Useful capabilities include:
- Token tracking
- Provider pricing
- Cost by model
- Cost by workflow
- Cost by tenant
- Cost per successful task
- Budget alerts
- High-cost trace detection
Privacy and Security
Evaluate:
- Data residency
- Encryption
- Access control
- Audit logs
- Content redaction
- Retention settings
- Self-hosting options
- Tenant isolation
- Compliance features
Operational Integration
The platform should integrate with:
- Incident management
- Existing dashboards
- Security operations
- Data warehouse
- CI/CD pipeline
- Alerting channels
- Identity provider
Scalability and Sampling
Understand:
- Ingestion limits
- Storage pricing
- Retention pricing
- Sampling support
- High-cardinality limits
- Query performance
- Trace export
Vendor Lock-In
Ask whether:
- Telemetry can be exported
- Evaluations are portable
- Data uses proprietary schemas
- Dashboards can be recreated elsewhere
- Instrumentation depends entirely on one provider
Build, Buy, or Extend an Existing Platform?
| Approach | Advantages | Limitations | Suitable For |
|---|---|---|---|
| Extend existing observability | Familiar tools and lower operational change | May lack AI-specific evaluations | Teams with mature monitoring |
| Dedicated AI observability platform | Strong tracing and evaluation features | Added vendor and cost | Teams operating many AI workflows |
| Cloud-provider platform | Tight integration with cloud services | Potential ecosystem dependency | Cloud-centered organizations |
| Custom platform | Full control and domain-specific behavior | High engineering and maintenance cost | Large or highly regulated systems |
| Hybrid approach | Balance of standards, specialized tools, and control | More integration work | Organizations with complex needs |
Production Implementation Roadmap
Phase 1: Define Success and Risk
Before instrumentation, document:
- Agent purpose
- Intended users
- Allowed actions
- Prohibited actions
- Task-success definition
- Quality requirements
- Cost budget
- Latency objective
- Human-approval rules
- Security risks
- Data sensitivity
Phase 2: Establish Correlation
Create consistent identifiers for:
- User request
- Session
- Agent run
- Workflow
- Model call
- Tool call
- Human approval
- Final outcome
Phase 3: Add Core Tracing
Start with:
- Root agent run
- Model calls
- Tool calls
- Retrieval
- Errors
- Token usage
- End-to-end duration
Phase 4: Add Quality Evaluation
Introduce:
- Task-completion checks
- Tool-selection checks
- Groundedness
- Policy compliance
- Human review
- User correction signals
Phase 5: Add Cost Attribution
Measure:
- Cost per step
- Cost per run
- Cost per successful task
- Cost by model
- Cost by tenant
Phase 6: Add Privacy Controls
Implement:
- Data classification
- Redaction
- Selective content capture
- Access control
- Retention
- Audit logs
Phase 7: Build Dashboards and Alerts
Create audience-specific dashboards and impact-based alerts.
Phase 8: Create the Improvement Loop
Use production findings to improve:
- Evaluation datasets
- Tool descriptions
- Prompts
- Models
- Retrieval
- Permissions
- Runbooks
- User experience
AI Agent Observability Checklist
Before Development
- Define the agent’s business purpose.
- Define what a successful task means.
- Identify high-risk actions.
- Classify tools by impact.
- Define human-approval requirements.
- Identify sensitive data.
- Select telemetry standards.
- Decide which content must never be recorded.
- Define initial cost and latency budgets.
- Create representative evaluation cases.
During Development
- Add root traces for complete agent runs.
- Trace model calls and tools.
- Propagate correlation identifiers.
- Record component versions.
- Add structured error categories.
- Add token and cost tracking.
- Test empty retrieval and tool failure.
- Test stop conditions and retry limits.
- Verify tenant isolation.
- Validate telemetry redaction.
Before Production
- Define dashboards.
- Define service and quality objectives.
- Add security alerts.
- Add cost alerts.
- Configure retention.
- Restrict trace access.
- Test incident reconstruction.
- Validate human-approval logging.
- Confirm fallback behavior.
- Run offline evaluations.
- Run adversarial tests.
- Confirm that raw sensitive content is disabled unless justified.
During Production
- Monitor task completion.
- Monitor quality trends.
- Monitor user corrections.
- Monitor cost per successful outcome.
- Review high-latency traces.
- Review repeated actions.
- Review blocked tool attempts.
- Evaluate sampled production traffic.
- Compare performance by version.
- Track human escalation.
- Review abnormal tenant behavior.
After an Incident
- Preserve relevant evidence.
- Identify the first failing step.
- Determine whether the cause was model, tool, data, memory, policy, or infrastructure.
- Review permissions and sensitive-data exposure.
- Create a regression test.
- Update error classification.
- Improve dashboards or alerts.
- Update the runbook.
- Reassess whether the failure could affect other workflows.
- Document the final corrective action.
Frequently Asked Questions
What is AI agent observability?
AI agent observability is the ability to understand an agent’s complete production behavior through traces, metrics, logs, evaluations, costs, security events, and business outcomes. It shows how the agent interpreted a task, which models and tools it used, what failed, how much it cost, and whether the final objective was achieved.
How is AI agent observability different from LLM monitoring?
LLM monitoring focuses mainly on model requests, responses, latency, token usage, errors, and output quality. AI agent observability covers the complete workflow, including planning, tool calls, retrieval, memory, sub-agents, permissions, approvals, evaluations, costs, and real-world outcomes.
Why is traditional application monitoring insufficient for AI agents?
Traditional monitoring usually measures uptime, errors, throughput, and infrastructure performance. An AI agent can remain technically available while producing incorrect answers, choosing unsafe tools, accessing irrelevant data, looping, overspending, or failing to complete the user’s task.
Which metrics should teams track for AI agents?
Important metrics include task-completion rate, first-pass success, end-to-end latency, model latency, tool success, tool-selection accuracy, retries, loops, token consumption, cost per successful task, evaluation scores, user corrections, human escalation, security events, and business outcomes.
How can teams trace an AI agent’s tool calls?
Each tool call should be represented as a trace span connected to the complete agent run. The span should record the tool name, sanitized arguments, permission context, duration, result, error category, retries, side effects, and approval status.
Can OpenTelemetry monitor AI agents?
OpenTelemetry can provide vendor-neutral traces, metrics, logs, and semantic conventions for generative AI operations. It can help correlate agent runs, model calls, tool invocations, and existing application infrastructure. Teams must still define quality evaluations, privacy controls, outcomes, and business-specific attributes.
Should prompts and responses be stored in production traces?
Not by default. Prompts and responses can contain secrets, personal data, customer records, or confidential documents. Full content should be collected only when there is a clear purpose, appropriate authorization, redaction, access control, retention policy, and compliance review.
How can teams monitor AI-agent costs?
Track token usage and external-service cost at the model-call, workflow-step, agent-run, user, and tenant levels. The most useful metric is often cost per successful task because it connects spending with actual value.
What is the difference between tracing and evaluation?
Tracing shows what happened during execution. Evaluation measures whether the behavior or result was correct, relevant, grounded, safe, and useful. A trace may show that a tool executed successfully, while an evaluation determines whether it was the right tool.
How can teams detect an agent trapped in a loop?
Look for repeated tool calls, similar model requests, repeated validation failures, increasing token consumption without state progress, and workflows reaching maximum-step limits. Alerts can be triggered when repetition exceeds expected patterns.
What should trigger human intervention?
Human intervention should be triggered when an action is high impact, irreversible, financially significant, security-sensitive, legally sensitive, outside policy, low confidence, or based on incomplete or conflicting information.
How long should AI-agent telemetry be retained?
Retention depends on the signal. Operational metrics may be retained differently from raw prompts, sampled traces, security incidents, and audit records. The policy should balance investigation needs, legal obligations, privacy risk, data minimization, and storage cost.
How can teams monitor multi-agent workflows?
Use a root trace for the complete task and child spans or linked traces for each delegated agent. Record delegation objectives, context, permissions, latency, cost, results, errors, and evaluation scores. The final trace should show which agent was responsible for each action.
What is cost per successful task?
Cost per successful task is the total cost of agent executions divided by the number of tasks that actually achieved their intended outcome. It is often more meaningful than average request cost because it accounts for retries, failures, and human corrections.
How can production failures improve AI agents?
Convert important failures into evaluation cases. Add the original scenario, expected behavior, failure category, relevant security or quality rule, and corrected outcome to the regression suite. Future model, prompt, tool, or retrieval changes can then be tested against it.
Conclusion
AI agent observability is not simply an extension of logging. It is a broader operational discipline designed for systems that make dynamic decisions, use external tools, retrieve changing information, access memory, consume variable resources, and sometimes take actions with real consequences.
A reliable observability strategy connects:
- Complete agent traces
- Model and tool telemetry
- Retrieval and memory evidence
- Token and cost measurement
- Quality and safety evaluations
- Security events
- Human approvals
- User feedback
- Business outcomes
The most important principle is to monitor the task, not only the technology.
An agent should not be considered successful merely because it returned a response. It should be considered successful when it completed the intended objective accurately, safely, efficiently, and within the user’s permissions.
Teams should begin with a clear definition of success, establish trace correlation across the complete workflow, collect only necessary data, add quality evaluation, measure cost per successful outcome, and turn every meaningful production failure into a future test.
As AI agents become more autonomous and more deeply connected to business systems, observability will become a basic production requirement rather than an optional diagnostic feature.
Organizations that design observability early will be better positioned to identify failures, control costs, protect sensitive data, improve quality, and operate AI agents with accountability.

💬 Comments
No comments yet. Be the first to comment!
Login to comment.